• Spectroscopy and Spectral Analysis
  • Vol. 42, Issue 10, 3109 (2022)
Ai-guo OUYANG*, Tong-zheng LIN, Jun HU, Bin YU, and Yan-de LIU
Author Affiliations
  • School of Mechanotronics and Vehicle Engineering, East China Jiaotong University, Nanchang 330013, China
  • show less
    DOI: 10.3964/j.issn.1000-0593(2022)10-3109-07 Cite this Article
    Ai-guo OUYANG, Tong-zheng LIN, Jun HU, Bin YU, Yan-de LIU. Optimization of Hardness Testing Model of High-Speed Iron Wheel by Laser-Induced Breakdown Spectroscopy[J]. Spectroscopy and Spectral Analysis, 2022, 42(10): 3109 Copy Citation Text show less
    Hardness detection points using QNESS 10A high-precision micro-hardness tester
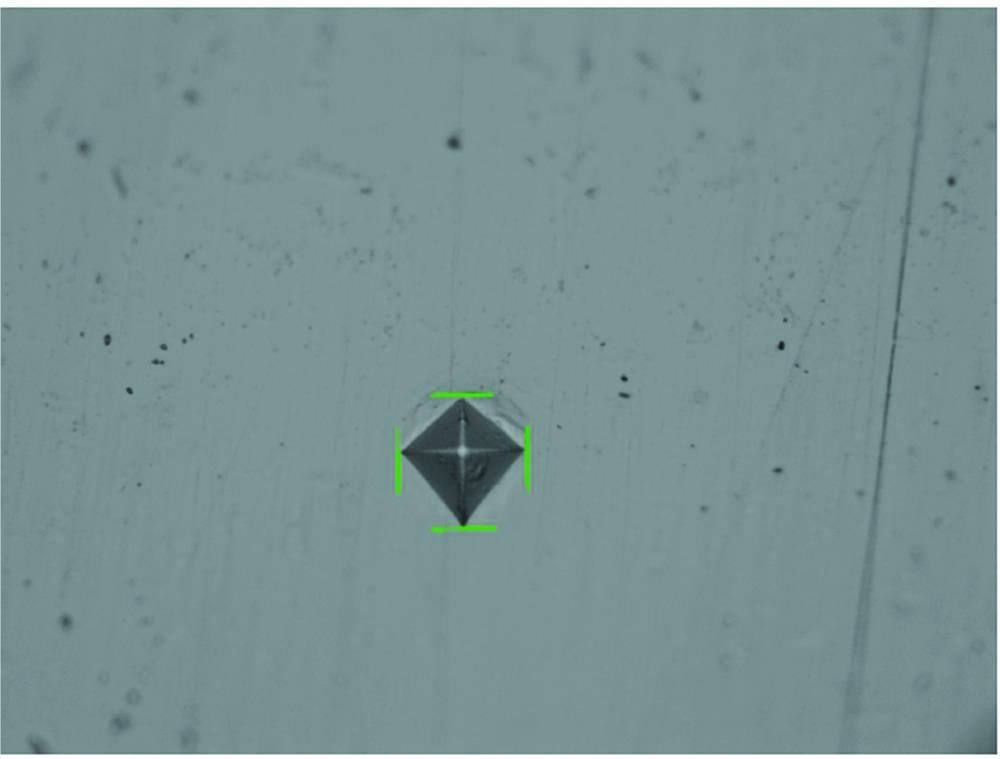
    Fig. 1. Hardness detection points using QNESS 10A high-precision micro-hardness tester
    Schematic diagram of LIBS system
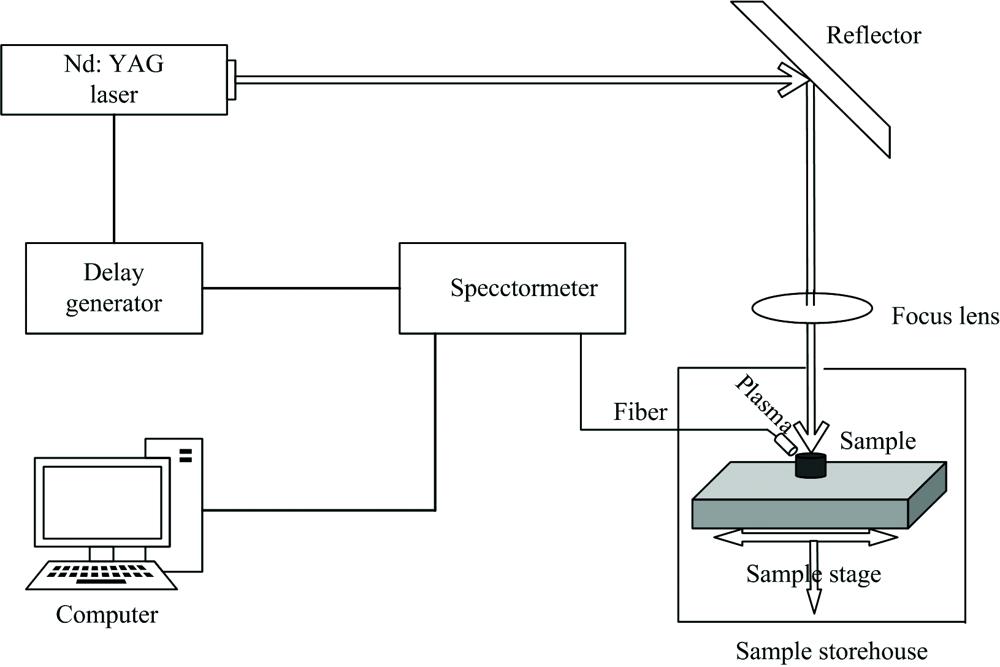
    Fig. 2. Schematic diagram of LIBS system
    Relationships between the spectral line strengths of matrix elements and alloy elements and the hardness of 8 samples
    Fig. 3. Relationships between the spectral line strengths of matrix elements and alloy elements and the hardness of 8 samples
    Correlations between the strength ratio of ion lines to atomic lines of matrix elements and alloying elements and sample hardness(a): Correlation between the strength ratio of Fe Ⅱ 238.203 8 nm to Fe Ⅰ 404.581 3 nm and sample hardness; (b): Correlation between the strength ratio of Cr Ⅱ 276.258 nm to Cr Ⅰ 425.433 1 nm and sample hardness
    Fig. 4. Correlations between the strength ratio of ion lines to atomic lines of matrix elements and alloying elements and sample hardness
    (a): Correlation between the strength ratio of Fe Ⅱ 238.203 8 nm to Fe Ⅰ 404.581 3 nm and sample hardness; (b): Correlation between the strength ratio of Cr Ⅱ 276.258 nm to Cr Ⅰ 425.433 1 nm and sample hardness
    Correlation between the spectral line strength ratio of alloying elements to matrix elements and sample hardness(a): Correlation between the strength ratio of Mo Ⅰ 313.259 4 nm to Fe Ⅰ 358.119 3 nm and sample hardness; (b): Correlation between the strength ratio of W Ⅰ 283.138 nm to Fe Ⅰ 358.119 3 nm and sample hardness
    Fig. 5. Correlation between the spectral line strength ratio of alloying elements to matrix elements and sample hardness
    (a): Correlation between the strength ratio of Mo Ⅰ 313.259 4 nm to Fe Ⅰ 358.119 3 nm and sample hardness; (b): Correlation between the strength ratio of W Ⅰ 283.138 nm to Fe Ⅰ 358.119 3 nm and sample hardness
    The prediction results of the model established using the full-band spectral line intensities after SNV pretreatment
    Fig. 6. The prediction results of the model established using the full-band spectral line intensities after SNV pretreatment
    Prediction results of the model established by combining the original data of spectral line intensity with the spectral line intensity ratio
    Fig. 7. Prediction results of the model established by combining the original data of spectral line intensity with the spectral line intensity ratio
    ElementMass fraction/%ElementMass fraction/%
    C4.401 3W6.047 5
    P0.037 5V2.271 3
    Si0.202 5Mn0.186 7
    Cr4.01Co1.418 3
    Mo5.29
    Table 1. Main chemical components of HS7 steel (Wt%)
    NumberMeasurement point 1
    value/HV
    Measurement point 2
    value/HV
    Measurement point 3
    value/HV
    Measurement point 4
    value/HV
    Measurement point 5
    value/HV
    Mean value
    /HV
    1#789809796794783794.2
    2#787821809824807809.6
    3#829807827823823821.8
    4#810801816768780795.0
    5#788791786792796790.6
    6#804802808791805802.0
    7#819798808817805809.4
    8#805804809814809808.2
    Table 2. Measured vickers hardness values of the samples
    VariableMethodPretreatment
    method
    LVsCalibration setPrediction set
    Rc2RMSECRp2RMSEP
    谱线强度PLS170.996 80.547 20.894 93.402 2
    SNV170.982 21.272 10.902 02.432 6
    S-G卷积二阶导120.961 61.965 30.903 63.240 5
    高斯滤波170.989 51.041 60.908 72.971 5
    Table 3. Evaluation index results of the model
    谱线类型谱线波长/nm
    Fe Ⅰ248.327 1, 248.814 3, 249.064 4, 252.284 9, 271.902 7, 278.810 5, 344.060 6, 358.119 3, 371.993 5, 373.486 4, 373.713 2, 374.556 1, 374.948 5, 375.823 3, 382.042 5, 385.991 1, 404.581 3, 438.354 5
    Fe Ⅱ234.349 5, 238.203 8, 239.562 5, 240.488 6, 249.326 4, 258.587 6, 259.836 9, 260.708 7, 261.187 4, 273.954 7, 274.932 2, 275.573 7
    Cr Ⅰ357.868 2, 359.348 1, 360.532 0, 425.433 1, 427.480 6, 428.973 3, 520.450 5
    Cr Ⅱ205.559, 206.154, 206.546, 267.719, 276.258, 276.655, 283.563, 284.324, 285.567, 286.51
    Mo Ⅰ313.259 4, 315.816 7, 317.034 4, 319.397 9, 320.883 8, 344.712 4, 379.825 2, 386.410 4, 390.295 3, 406.988 2, 418.832 4, 441.169 5, 550.649 4, 553.303 1, 557.044 4
    W Ⅰ255.135, 268.142, 272.435, 283.138, 289.644, 294.699, 321.556, 361.752, 400.875, 407.436, 429.461, 430.211
    Table 4. Spectral lines of manually selected matrix elements and alloy elements
    谱线比值类别构造谱线强度比值的谱线/nm
    Fe Ⅱ/Fe ⅠFe Ⅰ: 248.327 1, 248.814 3, 249.064 4, 252.284 9, 271.902 7, 278.810 5, 344.060 6, 358.119 3, 371.993 5, 373.486 4, 373.713 2, 374.556 1, 374.948 5, 375.823 3, 382.042 5, 385.991 1, 404.581 3, 438.354 5
    Fe Ⅱ: 240.488 6, 249.326 4, 258.587 6, 259.836 9, 260.708 7, 261.187 4, 273.954 7, 274.932 2, 275.573 7
    Cr Ⅱ/Cr ⅠCr Ⅰ: 357.868 2, 359.348 1, 360.532, 425.433 1, 427.480 6, 428.973 3
    Cr Ⅱ: 267.719, 276.258, 276.655, 283.563, 284.324, 285.567, 286.51
    Mo Ⅰ/Fe ⅠMo Ⅰ: 313.259 4, 315.816 7, 317.034 4, 319.397 9, 320.883 8, 344.712 4, 379.825 2, 386.410 4, 390.295 3, 406.988 2, 418.832 4, 441.169 5
    Fe Ⅰ: 248.327 1, 248.814 3, 249.064 4, 252.284 9, 271.902 7, 278.810 5, 344.060 6, 358.119 3, 371.993 5, 373.486 4, 373.713 2, 374.556 1, 374.948 5, 375.823 3, 382.042 5, 385.991 1, 404.581 3, 438.354 5
    W Ⅰ/Fe ⅠW Ⅰ: 255.135, 268.142, 272.435, 283.138, 289.644, 294.699, 321.556, 361.752, 400.875, 407.436, 429.461, 430.211
    Fe Ⅰ: 248.327 1, 248.814 3, 249.064 4, 252.284 9, 271.902 7, 278.810 5, 344.060 6, 358.119 3, 371.993 5, 373.486 4, 373.713 2, 374.556 1, 374.948 5, 375.823 3, 382.042 5, 385.991 1, 404.581 3, 438.354 5
    Table 5. Spectral lines used to calculate spectral line intensity ratios
    VariableMethodPretreatment
    method
    LVsCalibration setPrediction set
    Rc2RMSECRp2RMSEP
    谱线强度+
    谱线强度比值
    PLS160.993 30.785 10.944 12.436 5
    SNV150.960 01.932 60.909 12.902 7
    S-G卷积二阶导120.990 80.939 50.925 52.995 4
    高斯滤波150.971 11.674 40.920 72.781 5
    Table 6. Evaluation index results of the model
    Ai-guo OUYANG, Tong-zheng LIN, Jun HU, Bin YU, Yan-de LIU. Optimization of Hardness Testing Model of High-Speed Iron Wheel by Laser-Induced Breakdown Spectroscopy[J]. Spectroscopy and Spectral Analysis, 2022, 42(10): 3109
    Download Citation