
Chunlei Huang, Meisong Liao, Wanjun Bi, Xia Li, Lili Hu, Long Zhang, Longfei Wang, Guanshi Qin, Tianfeng Xue, Danping Chen, Weiqing Gao. Ultraflat, broadband, and highly coherent supercontinuum generation in all-solid microstructured optical fibers with all-normal dispersion[J]. Photonics Research, 2018, 6(6): 601
- Photonics Research
- Vol. 6, Issue 6, 601 (2018)
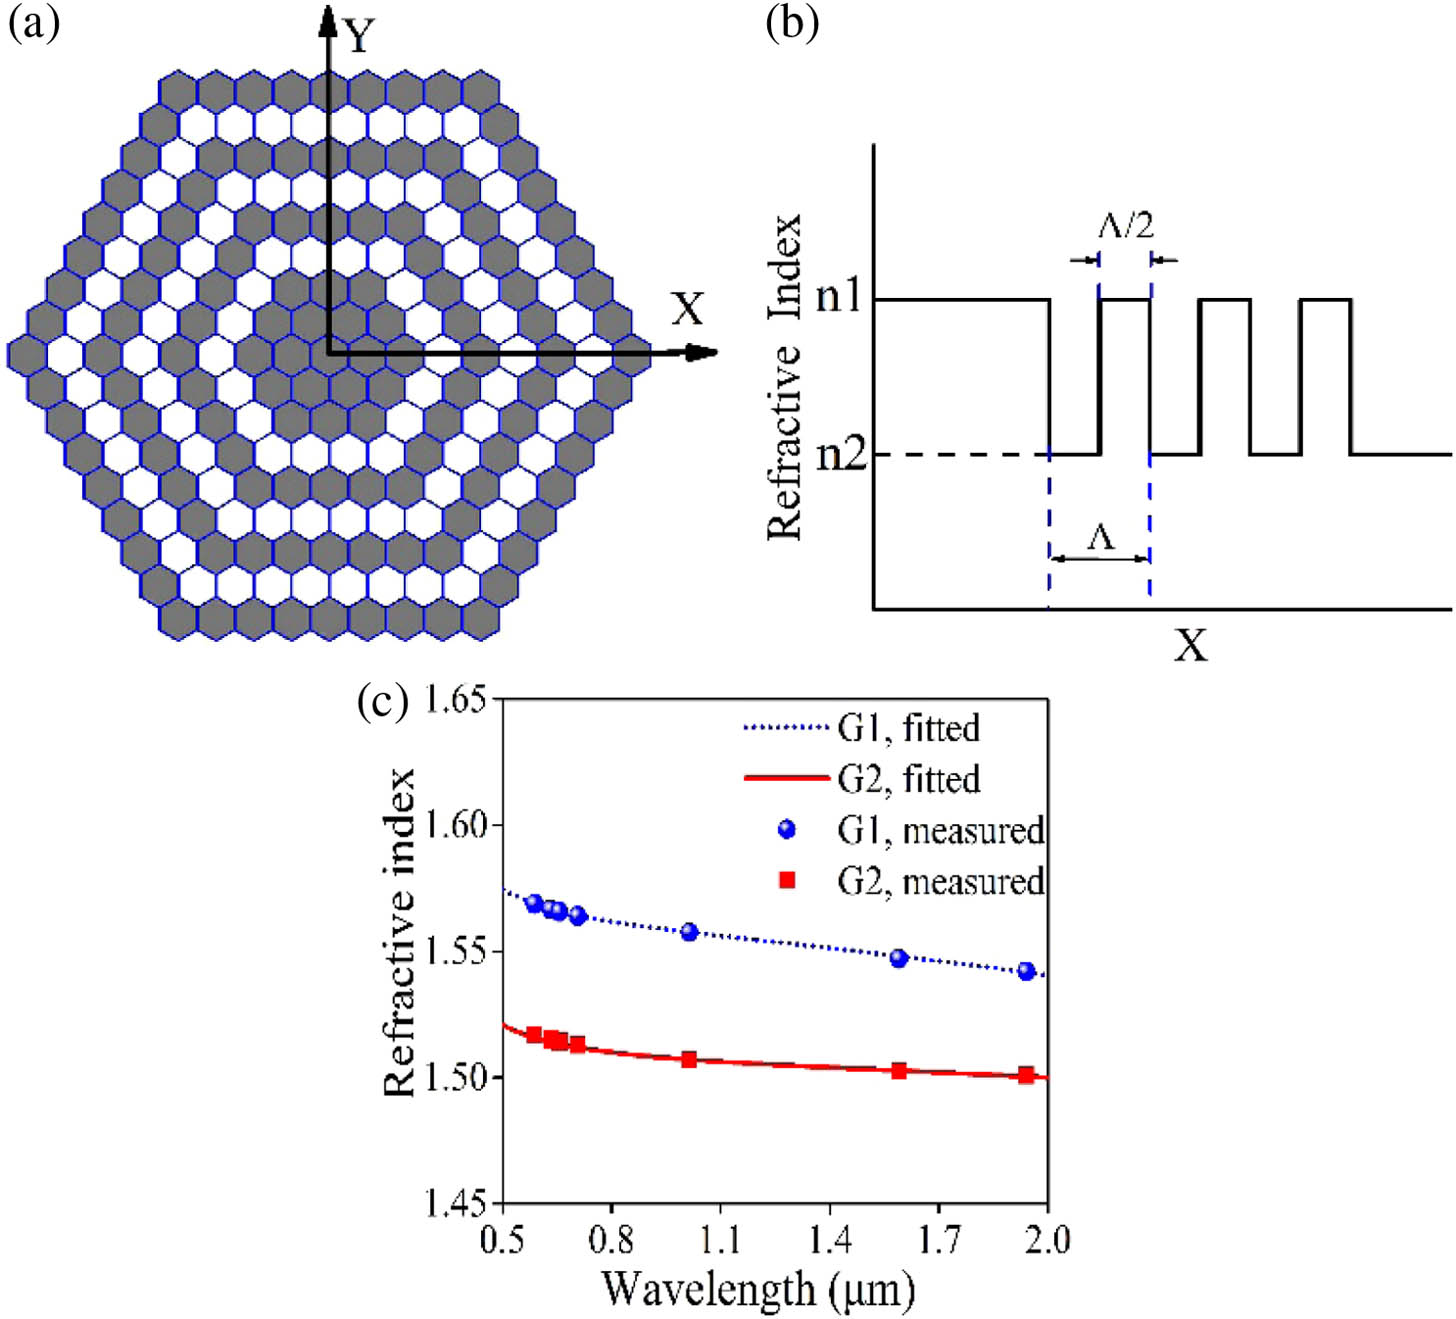
Fig. 1. (a) Schematic cross section and (b) refractive index profile of the all-solid microstructured fiber. The blue lines show the hexagonal elements. (c) Refractive index curves of G1 and G2 glasses.
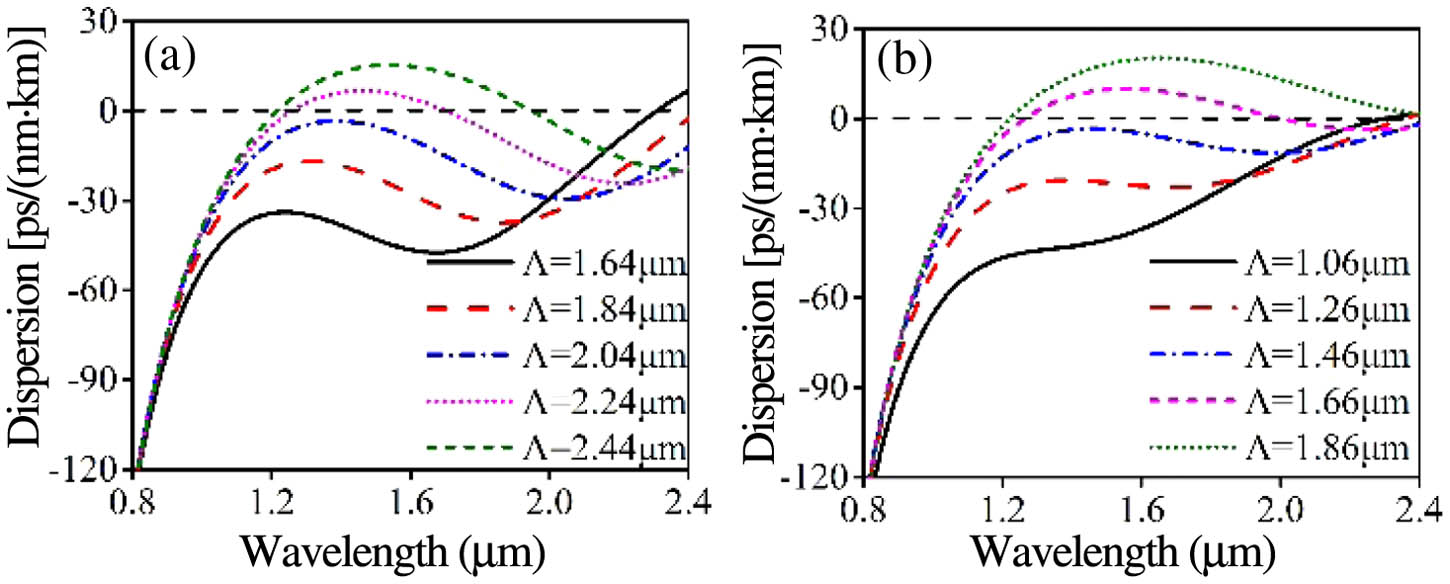
Fig. 2. Calculated spectral dependence of chromatic dispersion for all-solid MOF structures with various parameters of (a) Λ = 1.64 – 2.44 μm n = 3 Λ = 1.06 – 1.86 μm n = 4
Fig. 3. Schematic cross section of (a) fiber #A and (b) fiber #B; (c) calculated spectral dependence of chromatic dispersion of fiber #A and fiber #B.
Fig. 4. (a) Schematic cross section of fiber #C; (b) calculated chromatic dispersion and confinement losses of fundamental mode and the first HOM; (c) calculated values of dispersion slope and effective mode area of fundamental mode; (d) electric field distribution of the fundamental mode at 1550 nm.
Fig. 5. Pictures of cross sections of (a) the fabricated cane under an optical microscope and (b) the fiber under scanning electron microscope; (c) measured propagation loss of the fiber.
Fig. 6. Experimentally recorded and simulated SC spectra after 20 cm of the optical fiber. The pump pulse duration was 50 fs at 1.06 μm in both cases.
Fig. 7. (a) Spectral and (b) temporal evolution dependence on propagation distance; spectrum profiles at propagation distances of (c) 3 cm, (d) 5 cm, (e) 40 cm, and (f) 1 m. The green dashed lines in panel (a) chronologically show the location of panel.
Fig. 8. SC spectrum profiles after 1 m of propagation with pumping durations of 100 fs (blue dashed line), 200 fs (black solid line), and 300 fs (red dotted line). The peak power is 100 kW at 1.55 μm.
Fig. 9. Influence of linear loss on SC generation after a fiber of 1 m in length. The pump pulse durations are 200 fs at 1.55 μm. The peak power is 100 kW and 150 kW, respectively.
Fig. 10. (a) Computed modulus of the complex degree of coherence of SC spectrum; (b) achievable pulse width only using linear compression.
|
Table 1. Some Critical Parameters of G1 and G2
|
Table 2. Sellmeier Coefficients of G1 and G2

Set citation alerts for the article
Please enter your email address
© Copyright 2018-2021 | Chinese Laser Press. All Rights Reserved 沪ICP备15018463号-20