
Peng-cheng ZHU, Hao-ran LIU, Xiang-guang JI, Qi-hua LI, Guo-hua LIU, Yuan TIAN, Heng XU. Study on Measurement of Troposphereic NO2 in Beijing by MAX-DOAS[J]. Spectroscopy and Spectral Analysis, 2021, 41(7): 2153
- Spectroscopy and Spectral Analysis
- Vol. 41, Issue 7, 2153 (2021)
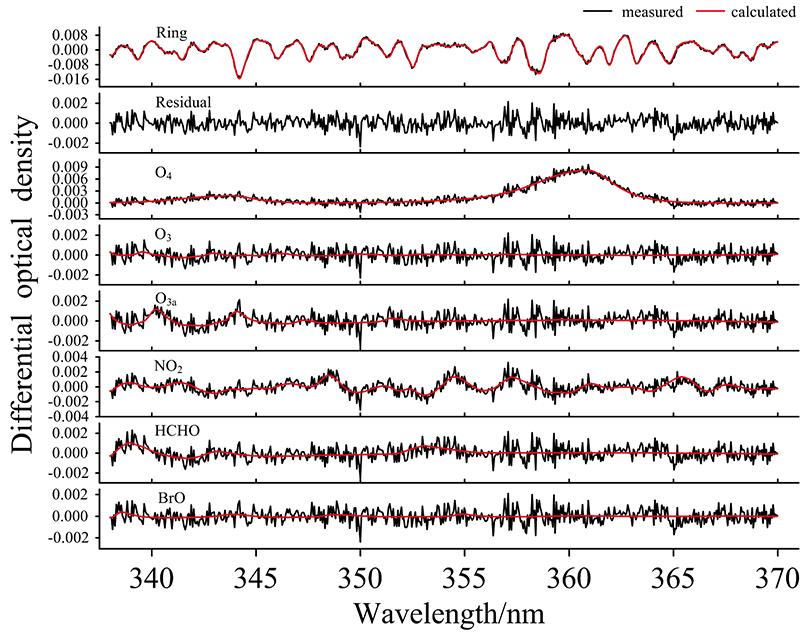
Fig. 1. An example of fitting a measured spectrum
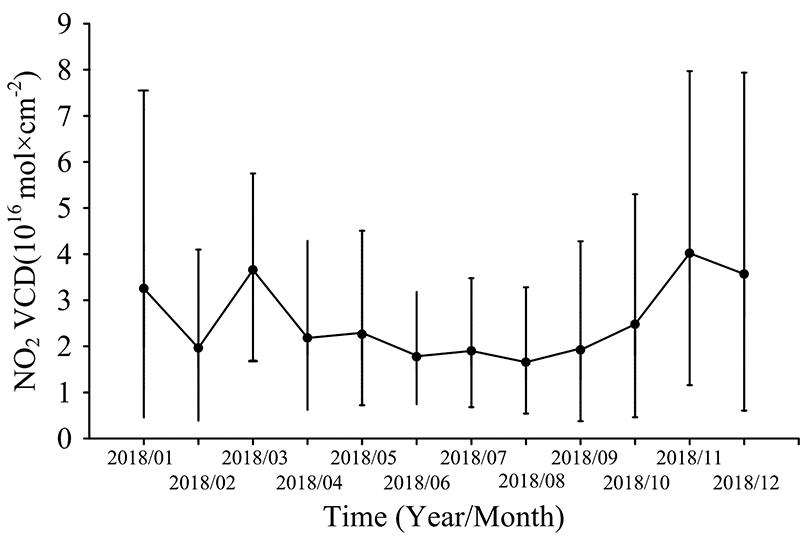
Fig. 2. Time-series distribution of monthly mean values of verticalcolumn concentration of troposphere NO2 in 2018
Low (high) error bars indicate that 10% (90%) of the overall date corresponds to date points, and solid points indicate the mean value
Low (high) error bars indicate that 10% (90%) of the overall date corresponds to date points, and solid points indicate the mean value
Fig. 3. The average daily change of NO2 VCD in the troposphere in different seasons in 2018
The low (high) error bar indicates that the overall date corresponds to 25% (75%) of the data point, and the solid point indicates the mean value
The low (high) error bar indicates that the overall date corresponds to 25% (75%) of the data point, and the solid point indicates the mean value
Fig. 4. Daily average daily change of tropospheric NO2 VCD in 2018
Fig. 5. Comparison of monthly average changes of ground- based MAX-DOAS and ground stations
Low (high) error bars, the boxes are 10% (90%), 25% (75%) correspond to data points, the solid points represent the mean
Low (high) error bars, the boxes are 10% (90%), 25% (75%) correspond to data points, the solid points represent the mean
Fig. 6. Correlation between ground-based MAX-DOAS and ground station data results
|
Table 1. Setting used for nitrogen dioxide DSCDs retrieval
|
Table 2. Mean of tropospheric NO2 VCD in different seasons
|
Table 3. Daily mean value of NO2 VCD in the troposphere in one week

Set citation alerts for the article
Please enter your email address
© Copyright 2018-2021 | Chinese Laser Press. All Rights Reserved 沪ICP备15018463号-20