
Hongwei He, Zhihang Wu, Zhaoxin Yu, Xianglian Feng, Hexin Jiang, Shiming Gao. Detection Algorithm of Support Vector Machine for Four-Level Free-Space Laser Communication Signals[J]. Acta Optica Sinica, 2018, 38(11): 1101002
- Acta Optica Sinica
- Vol. 38, Issue 11, 1101002 (2018)
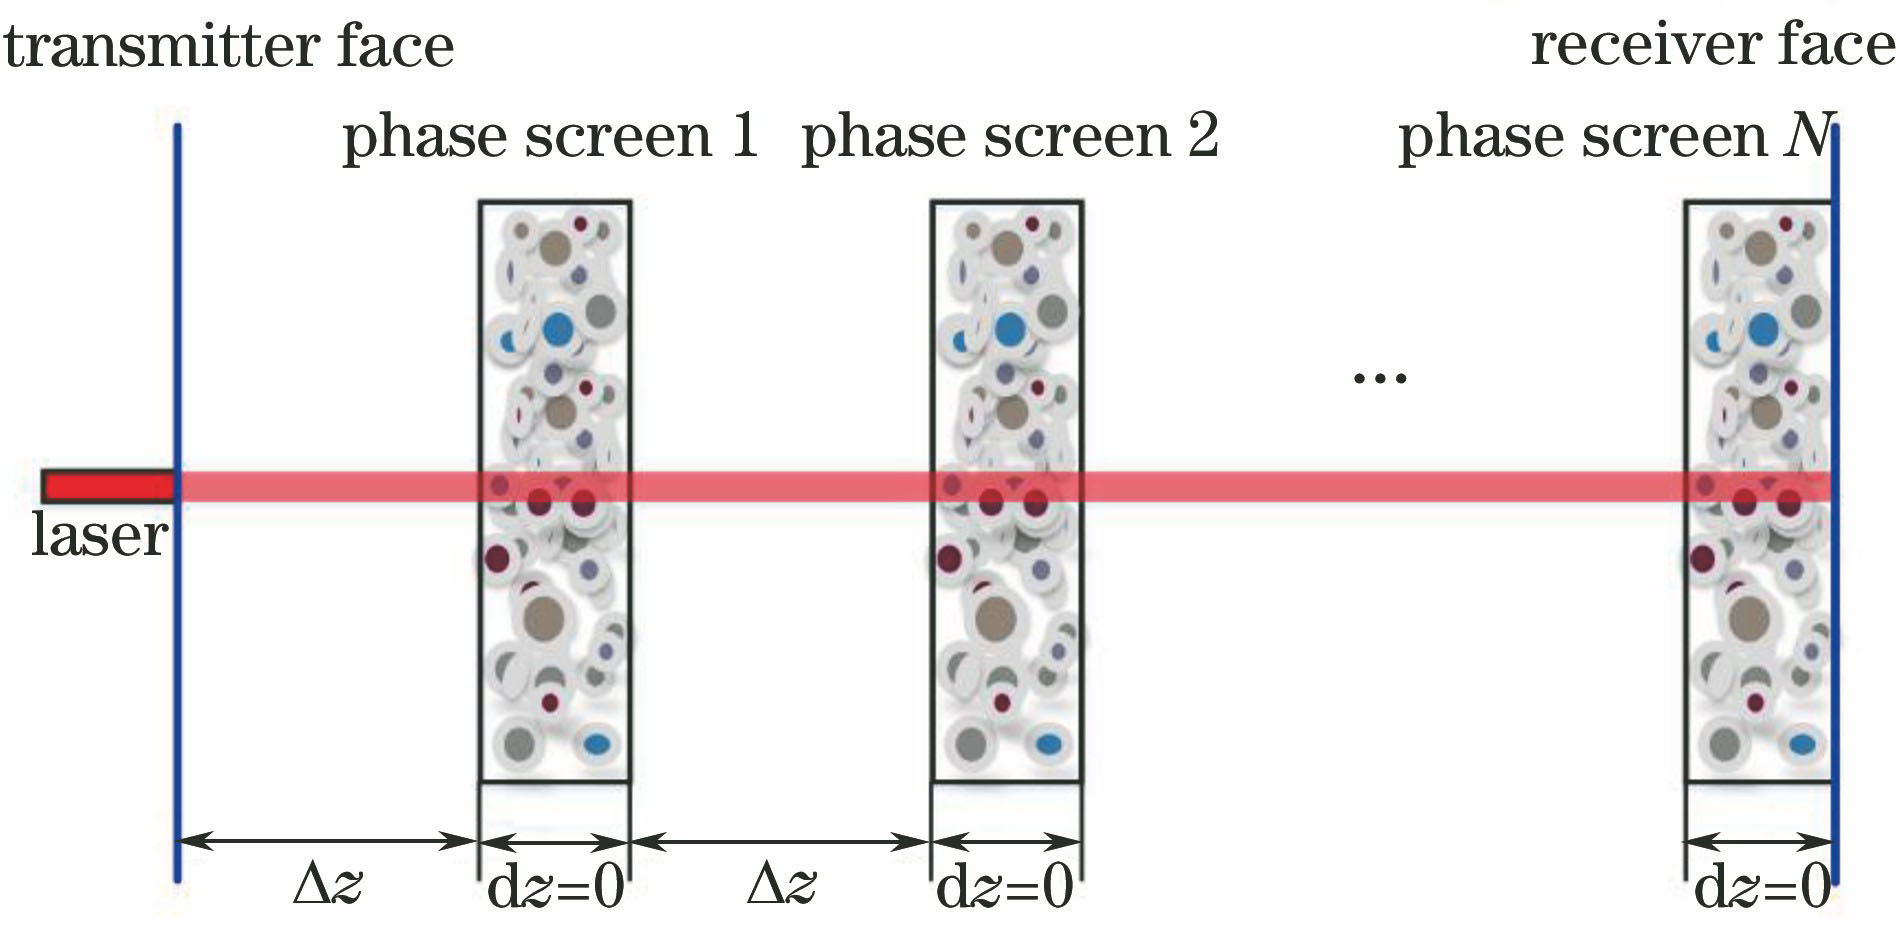
Fig. 1. Schematic of atmospheric turbulence channel simulated by phase screens
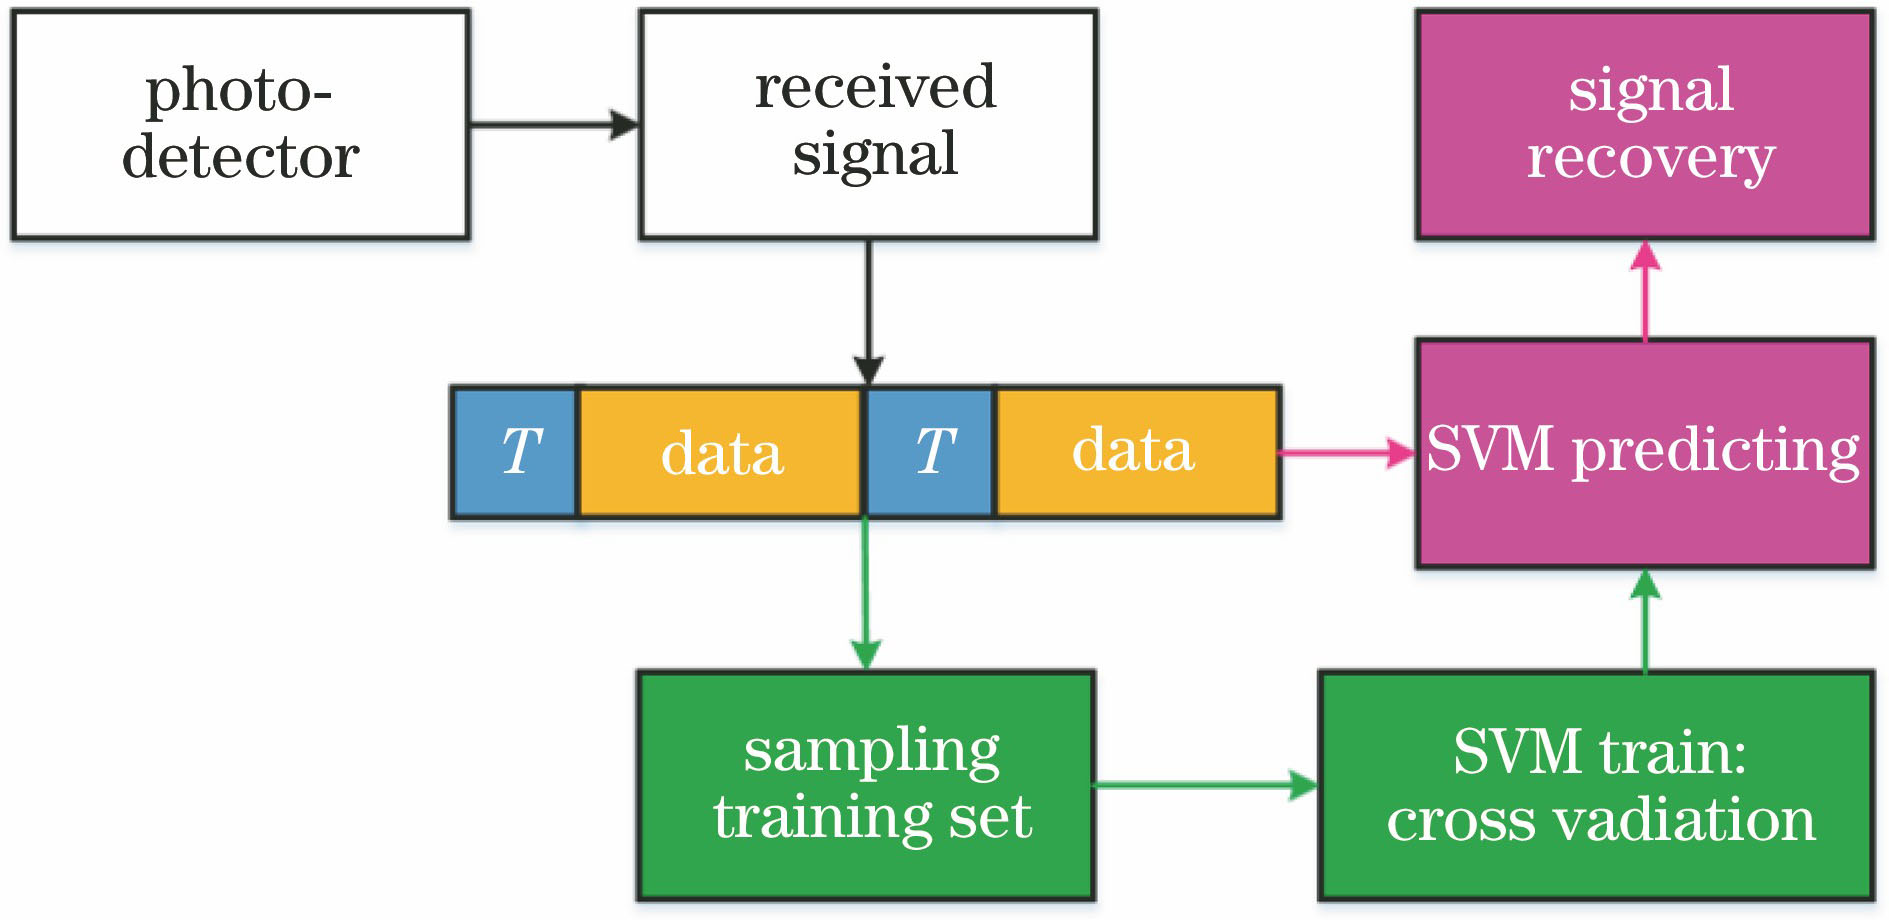
Fig. 2. Flow chart of SVM detection algorithm
Fig. 3. Normalized received intensity distributions when Rytov variance is (a) 0.1, (b) 0.3, (c) 0.5 and (d) 0.7, respectively
Fig. 4. Mean normalized intensities change with time when Rytov variance is (a) 0.1, (b) 0.3, (c) 0.5 and (d) 0.7, respectively
Fig. 5. Simulated time-varying signals at receiving end when Rytov variance is (a) 0.1, (b) 0.3, (c) 0.5 and (d) 0.7, respectively
Fig. 6. Threshold and judgment based on SVM detection algorithm for PAM-4 signals. (a) σR2=0.1; (b) σR2=0.3; (c) σR2=0.5; (d) σR2=0.7
Fig. 7. BER curves when Rytov variance is (a) 0.1, (b) 0.3, (c) 0.5 and (d) 0.7, respectively
Fig. 8. BER curves change with atmospheric turbulence intensity
|
Table 1. Relationship of atmospheric refraction index structure parameter and Rytov variance

Set citation alerts for the article
Please enter your email address
© Copyright 2018-2021 | Chinese Laser Press. All Rights Reserved 沪ICP备15018463号-20