
Wenwei Ye, Jinxuan Huang, Tianfu Zhou, Feng Lin. Design of Continuous Zoom Double Telecentric System and Analysis of Cam Curve[J]. Laser & Optoelectronics Progress, 2020, 57(5): 052201
- Laser & Optoelectronics Progress
- Vol. 57, Issue 5, 052201 (2020)
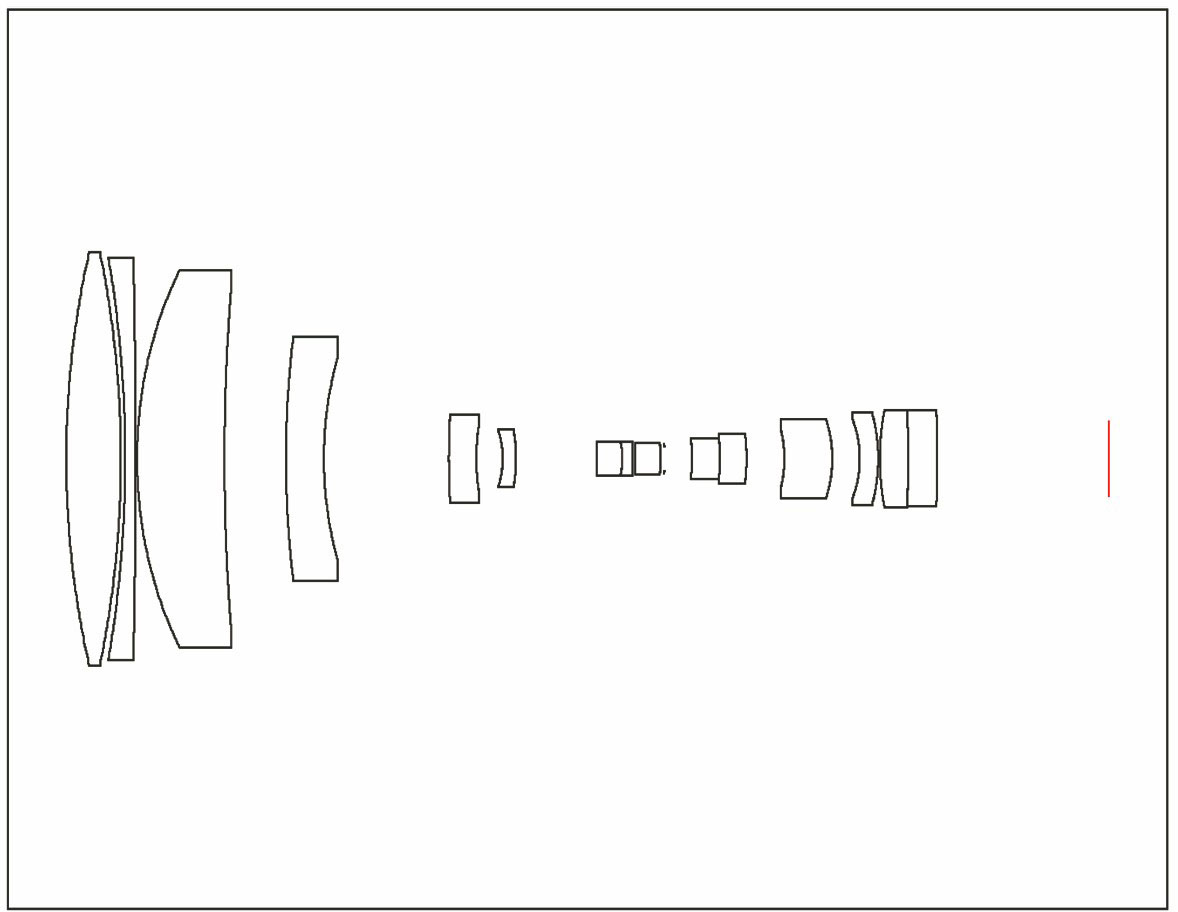
Fig. 1. Diagram of initial system structure
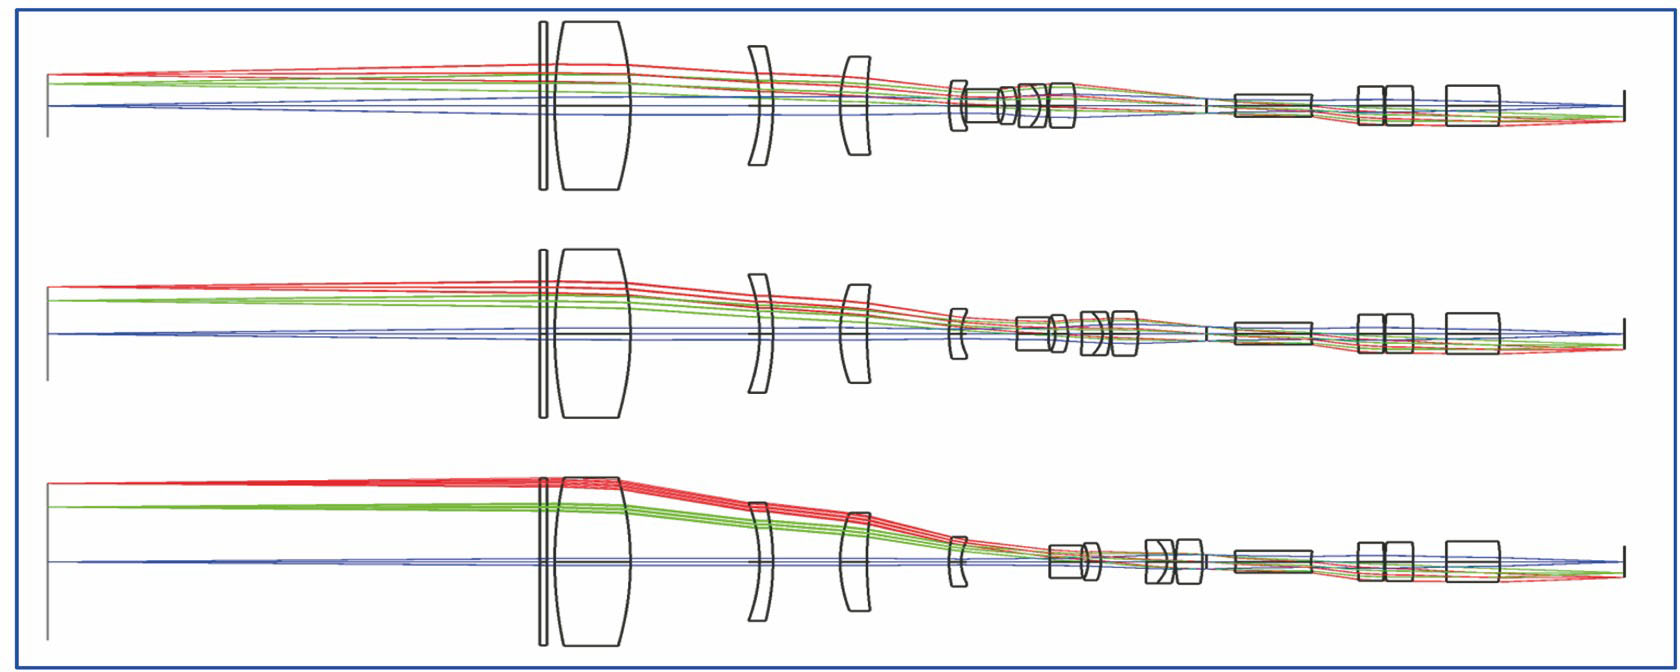
Fig. 2. Outline drawing of the optical system
Fig. 3. MTF and distortion curves at -0.20×. (a) MTF curve of the system; (b) distortion curve of the system
Fig. 4. MTF and distortion curves at -0.33×. (a) MTF curve of the system; (b) distortion curve of the system
Fig. 5. MTF and distortion curves at -0.50×. (a) MTF curve of the system; (b) distortion curve of the system
Fig. 6. Flow chart of Zemax macro language programming method
Fig. 7. Cam curve obtained by Zemax macro language programming
Fig. 8. Grouping of zoom systems
Fig. 9. Cam curve obtained by dynamic optics theory
Fig. 10. Difference between solution data points obtained by two methods
|
Table 1. Imaging chip parameters
|
Table 2. System design parameters
|
Table 3. Multiple structure operand settings
| ||||||||||||||||||||||||||||||||||||
Table 4. Partial sampling point data obtained by software method
| ||||||||||||||||||||||||||||||||||||
Table 5. Partial sampling point data obtained by dynamic optics theory

Set citation alerts for the article
Please enter your email address
© Copyright 2018-2021 | Chinese Laser Press. All Rights Reserved 沪ICP备15018463号-20