Junyi Wu, Bo Zhang, Weihua Wang, Weipeng Li, Xiyu Yao, Dawei Wang, Wei Xing, Ming Yan. Laser Wire Additive Manufacturing of Ti‑6Al‑4V Alloy and Its Machine Learning Study for Parameters Optimization (Invited)[J]. Chinese Journal of Lasers, 2024, 51(4): 0402305
Copy Citation Text
Ti-6Al-4V is a benchmark Ti alloy. Laser wire additive manufacturing (LWAM) offers advanced manufacturing capability to the alloy for applications possibly including exploration of outer space. As a typical multiple-variable process, LWAM is complex, which, however, can be analyzed, predicated or even optimized by artificial intelligence (AI) methods such as machine learning (ML). In this study, printing parameters of the Ti-6Al-4V is firstly optimized using single-track-single-layer experiments, and then single-track-multiple-layer samples are printed, whose properties in terms of hardness and compressive strength are analyzed subsequently by both experiments and ML. The two ML approaches, artificial neural network (ANN) and support vector machine (SVM), are employed to predict the experimental results, whose coefficients of determination R2 show good values. Further optimized properties are realized by adopting genetic algorithm (GA) and simulated annealing (SA) approaches, which contribute to high mechanical properties achieved, for instance, an engineering compressive strength of about 1694 MPa. The results here indicate that important mechanical properties of the LWAM-prepared Ti alloys can be well predicted and enhanced using suitable ML approaches.
Ti-6Al-4V is a benchmark Ti alloy,being widely used in many industries including aerospace engineering,biomedical engineering and chemical engineering[1-2]. However,conventional manufacturing of the Ti-6Al-4V alloy is not easy,while additive manufacturing(AM)and three-dimensional(3D)printing offers superior capability to its manufacturing[3-4]. Among the various AM approaches,wire-fed directed energy deposition(DED)of Ti-6Al-4V,such as based on laser,i.e.,laser wire additive manufacturing(LWAM),has a few unique advantages[5-7]:1)the printing speed can be a few times faster than,e.g.,the selective laser melting(SLM)AM;2)raw material for the LWAM can be more cost affordable than the powder-bed based AM approaches;3)using metal wire rather than loose powder as feedstock,LWAM maybe one day becomes a feasible methodology to produce useful parts for outer space exploration,e.g.,the moon.
In regard of LWAM,Mok et al.[8] studied the effects of wire feeding direction on deposition efficiency,along with other affecting parameters. It has been confirmed that a high deposition rate and good deposition quality can be realized by using LWAM. Li[9] and Du[10] studied the influencing factors for LWAM-prepared Ti-6Al-4V alloy;good printed parts have been achieved thereby. Li[11] designed an optical coaxial printing head,which facilitated adjustment of focal position of the used annular laser beam,led to coaxial coupling between the laser beam and the metal wire,and achieved good printing results in the end.
On the other hand,laser-based printing,including LWAM,is a typical multiple-variable process,making experimental explorations tedious and often not conclusive. In recent years,machine learning(ML)approaches have been widely adopted to facilitate understanding real world problems including the AM&3D printing process[12-14]. In general,although with shortcomings such as large initial data input and often unclear mathematical relationship between input and output,it is still a powerful technology that automatically extracts and analyzes features from existing data,establishes relationship model between inputs and outputs,and provides inference for predicting new data.
To date,SVM and ANN are among the most commonly used ML algorithms[15-16]. The former aims to generate the most suitable decision limit or boundary,i.e.,the so-called hyperplane,which divides the n-dimensional space into various categories,making it easy to place different points in each category. It has been applied in image classification,text classification,and other fields[17]. The latter is to create a machine that can work like the human brain which can “think”. It normally consists of multiple layers:an input layer as the raw data access,hidden layers for feature extracting and processing,and an output layer in which the final results are obtained. Before ANN can be fully functionalized,it must be trained,while the most common algorithm is the back propagation[18].
Examples of ANN and SVM for AM&3D printing can be noted as follows. Jia et al.[19] used the ANN algorithm to establish relationship between printing parameters of SLM and mechanical properties;they also optimized the parameters using genetic algorithms(GAs)in order to prepare samples with high size accuracy and good mechanical properties. For selective laser sintering(SLS),Ma et al.[20] established a multi-objective optimization model based on energy consumption,material cost and machine constraints,where the SLS energy consumption framework was optimized using the non-dominated sorting genetic algorithm-Ⅱ(NSGA-II). For laser directed energy deposition(LDED),Singh et al.[21] studied the relationship among printing factors such as powder feeding rate and powder deposition efficiency,using multiple algorithms such as multi-objective particle swarm optimization. Aboutaleb et al.[22] developed a method for systematically optimizing mechanical properties of laser additive manufactured parts by using minimum energy design principle.
From existing literature,it is noted that for multiple-variable process such as AM,ML approaches are capable to create the relationship between printing parameters and part properties,and in turn,ultimately optimize the printing parameters to improve the performance of the printed products. In particular,wire-fed laser based AM approaches such as LWAM just emerge and they are far from mature,and there are short of reliable case studies. The present study is therefore designed to provide valuable insights into the area,incorporating ML in LWAM experiments. The results will show that after collecting data from single-track-multiple-layer experiments,ML approaches including SVM and ANN are capable to eventually provide predictions with high accuracy in terms of hardness and compressive strength.
2 Experimental and machine learning study
2.1 Materials and laser wire additive manufacturing
Wire of Ti-6Al-4V(∅1.2 mm)was used as the raw material,whose chemical composition is shown in Table 1. The building substrate was Ti-6Al-4V plate too,with dimensions of 130 mm×130 mm×12 mm.
Table Infomation Is Not Enable
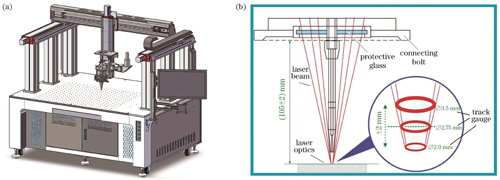
The LWAM system was self designed[Fig. 1(a)],using a CoaxPrinter high-performance laser head produced by Precitec in Germany,whose wavelength ranged from 900 to 1080 nm and generated circular laser beam. As shown in Fig. 1(b),the Ti-6Al-4V wire and the laser beam were co-axial with each other. During experiments,different laser powers,feeding speeds,scanning speeds and height distances had been studied(see Table 2 for the parameters adopted).
Figure 1.Experimental setup. (a) Schematic graph of the LWAM; (b) coaxial design of the laser head
2.2 Microstructure characterization and mechanical property testing
Microstructures of the as-printed samples were examined mainly using a field-emission scanning electron microscope(SEM,Zeiss Merlin,Germany)equipped with an EDAX VelocityTM electron backscatter diffraction(EBSD)camera(Ametek,USA). Vickers hardness was conducted using hardness tester(HXD-1000TMC,Shanghai Taiming Optical Instrument Corporation,China),with a load of 9.807 N and a loading time of 15 s;nine positions were tested for each sample,and the corresponding averaged value was used. Compressive test was conducted using an LE5105 electronic universal testing machine. Three cylindrical samples(∅3 mm×6 mm)were tested,whose values were then averaged and used.
2.3 ML procedure and overall research flowchart
2.3.1 ANN algorithm
The ANN algorithm has been operated in the following way[15-16,23]. A reverse parameter adjustment method was adopted for the ANN process. A ReLU activation function and a gradient descent method were used in the back propagation parameter adjustment. Herein,the activation function adjusts linear data relationship to nonlinear data relationship,thereby achieving the effect of simulating nonlinear complex function models,while the purpose of the training is to continuously adjust the initial weights to minimize the error between the predicted output value and the expected value.
2.3.2 SVM algorithm
The SVM algorithm has been operated in the following way[15-16,23]. Gaussian kernel function is selected for the SVM operation,whose function is written as
,
where x means input,y means output,and γ means the Gaussian kernel width.
It is necessary to determine the parameters,i.e.,Gaussian kernel width and penalty factor,in the model. This study used cross validation and grid search methods to determine these two hyperparameters.
2.3.3 Genetic algorithm optimization
To operate the GA prediction and optimization,we have firstly defined an objective function Q,as follows,while GA is to provide near optimal solutions for optimizing the objective or fitness function of the defined problem[23-24]:
,
where Y1 and Y2 are the two targets corresponding to hardness and compressive strength,respectively,and w1 and w2 are corresponding weight ratios.
Considering that both hardness and compressive strength are important performance indicators,here w1 and w2 are both set to 1,and the above function can be rewritten as
.
To start the GA simulation,initialization setting needs to be done. Commonly used parameters are set according to the following experience,and they were selected as shown in Table 3[23-24]:1)N,the population size,ranging from 30 to 100;2)T,the number of iterations for calculation,ranging from 100 to 500;3)Pc,crossover probability,ranging from 0.4 to 0.99;4)Pm,mutation probability,ranging from 0.0001 to 0.1.
Table Infomation Is Not Enable
2.3.4 Simulated annealing algorithm optimization
The simulated annealing(SA)algorithm is an algorithm for finding the minimum energy status from various options;the purpose is to prevent getting stuck in poor solutions relating to local optima of the fitness function[23,25]. Before starting the SA algorithm,the parameters that need to be set include the starting temperature Tb,ending temperature Te,maximum number of iterations n,and probability coefficient s1 for accepting the different solutions[23,25](see Table 4). The initial state is obtained from the process interval using a random function,and the search boundary is specified as the entire process interval of the experiment.
Table Infomation Is Not Enable
2.3.5 Overall research flowchart
The overall research flowchart for the current study is planned as follows(see Fig. 2). Firstly,single-track-single-layer experiments will be conducted,through which optimal printing parameters are determined. Secondly,single-track-multiple-layer samples will be printed using determined optimal parameters. Bulk samples will be therefore analyzed in terms of their compressive strength and hardness. The two mechanical properties will be used as experimental output,while printing parameters will be used as input,for the following SVM and ANN predictions. Two other algorithms,i.e.,GA and SA,will be used to predict the best printing parameters for SVM,based on which further improved properties can be expected. The predictions made by the ML approaches will be cross-checked by experimental results. In the end,comparison between ANN and SVM will be briefly discussed as well.
3.1 LWAM printing,experimental data and microstructural analysis
3.1.1 Single-track-single-layer printing
During single-track printing,a suitable laser energy is required,which should be able to melt the wire and generate interface bonding between molten droplets and the substrate. Figure 3 shows a snapshot of the deposition process and an optical microscope(OM)image of an as-printed single track. For printing parameters optimization,a coefficient,λ,has been defined and used in evaluation,i.e.,λ=H/W,where H is the height of the track and W is the width. If the λ value is too small,it is not easy to complete the printing process and it possibly causes waste of feedstock material. If the λ value is too large,then the molten droplets from the subsequent building layer may flow downwards along the curved surface,possibly causing the whole sample to collapse. Referring to literature[8-11] and from our own experience,the suitable λ value ranges between 0.40‒0.65,and it will be discussed in the following section.
Figure 3.Deposition process in the single-track-single-layer printing and illustration of the coefficient λ. (a) Snapshot of the deposition process; (b) OM image of the as-printed single track; (c) illustration of a suitable λ value; (d) illustration of an overshoot λ case
In subsequence,different laser powers,feeding speeds and scanning speeds were adopted,and the corresponding λ values were recorded and compared. The results are shown in Figs. 4(a)‒4(f). The main results are described as follows.
Figure 4.Experimental results for different printing parameters. (a) Change of H and W with laser power and (b) the corresponding λ; (c) change of H and W with scanning speed and (d) the corresponding λ; (e) change of H and W with feeding speed and (f) the corresponding λ
1)As shown in Figs.4(a)and 4(b),as the laser power increases within the range of 1800‒2400 W,the width W increases correspondingly,from 373 to 452 μm,while the height H gradually decreases from 213 to 165 μm. The corresponding λ value is between 0.40 and 0.48,falling in the suitable range as aforementioned. If the laser power is lower than 1800 W,the λ value will be less than 0.40 according to the trend observed.
2)As shown in Figs.4(c)and 4(d),when the scanning speed increases from 30 to 50 mm/min,the width W drops from 453 to 405 μm,and the height H drops from 295 to 203 μm. The reason for the lowered W and H is a decreased energy input. The corresponding λ value is ~0.50‒0.65.
3)As shown in Figs.4(e)and 4(f),when the wire feeding speed increases but the energy input is kept unchanged,the width W increases from 152 to 207 μm,and the height H increases from 355 to 431 μm. The corresponding λ value ranges from 0.42 to 0.48. Too low feeding speed,however,such as 350 mm/min,will lead to a λ value of less than 0.40,whose details are omitted here.
4)After a series of experiments as shown in the figures,the process window for printing the Ti-6Al-4V wire has been determined as follows. The range of laser power P is 1600‒2400 W,the range of wire feeding speed vf is 350‒600 mm/min,and the range of scanning speed vsis 30‒50 mm/min.
3.1.2 Single-track-multiple-layer printing
After optimizing single-track printing,single-track-multiple-layer samples[see Fig. 5(a)]were built in the following way. Firstly,a definition of vertical overlap has been proposed,which is η(=H0/H)and is illustrated in Fig. 5(b). A suitable η ensures that height and width of the printed samples remain basically unchanged,and thin-walled parts can be printed smoothly subsequently. If the η value is too large,the overlap area between the two layers increases,and the width of the layers widens,causing a slowly increased height and a low deposition efficiency. If the η value is too small,the size of the thin-walled parts may change violently as the number of layers increases,possibly leading to a bad geometry accuracy. From literature[3] as well as our own experience,when the η value is close to 1/3,the overlap between layers is appropriate. By using such an η value,good single-track-multiple-layer samples in the form of bulk tube have been printed[see Figs.5(c)and 5(d)].
Figure 5.LWAM printing results and images. (a) Single beam and multiple layers; (b) illustration of the vertical heights (H and H0);
A brief analysis of the as-printed microstructure is shown in Fig. 6. Figures 6(a)‒6(d)are SEM secondary electron images with different magnifications,whose EBSD reverse pole figure is shown in Fig. 6(e). It is noted that the microstructural feature of the as-printed Ti-6Al-4V is a mixture of acicular phases(major phase),and a small amount of lath phases. The former should be the martensite α' phase[3,26],while the latter should be the β‑Ti phase. Such microstructure is typical to many other laser printed Ti materials[3,26]. Meantime,it is noticed that there are virtually no pores in the as-printed samples,suggesting that the optimized parameters are good in terms of achieving high relative density and a pore-free microstructure.
Figure 6.Analysis of the as-printed microstructure. (a)‒(d) SEM images of the as-printed Ti-6Al-4V at different magnifications;
3.1.3 Collection of the results data for the as-printed Ti-6Al-4V
By following the previously determined printing parameters,in total 96 samples have been printed. The corresponding experimental data have been collected for the following ML processing. Part of the results are shown in Table 5,with the whole data provided in the Appendix Table A1.
Table Infomation Is Not Enable
3.2 ML for data regression and prediction
3.2.1 ML by the ANN approach
In this study,for the ANN to operate,the total 96 sets of printing parameters and corresponding mechanical properties are randomly divided into two groups,with 76 as the training group and 20 as the test group. Meantime,the four major printing parameters,namely the laser power,wire feeding speed,scanning speed and overlap height,are used as inputs;the hardness and compressive strength are used as outputs. The ML performances are shown in Figs. 7 and 8.
Figure 7.Prediction results of the ANN model for hardness of as-printed samples. (a),(b) Experimental values, predicted values and the corresponding R2 based on the training set; (c),(d) experimental values, predicted values and the corresponding R2 based on the test set
Figure 8.Prediction results of the ANN model for compressive strength of as-printed samples. (a), (b) Experimental values, predicted values and the corresponding R2 based on the training set; (c), (d) experimental values, predicted values and the corresponding R2 based on the test set
From Fig. 7,it is noted that when using the ANN to regress the hardness values,the corresponding R2,i.e.,the coefficient of determination,has been determined as 0.963 for the training set,and 0.898 for the test set. Meantime,the corresponding root-mean-square error(RMSE)is 1.018 for the training set,and it is 1.647 for the test set. The regressions for the test set are good,indicating strong capability of the ANN approach used to handle the experimental data obtained.
Similarly,Fig. 8 provides the compressive strength results and the corresponding ANN simulations. It indicates that R2 is 0.959 for the training set,and 0.739 for the test set. Meantime,RMSE of the training set is 9.480,and it is 20.620 for the test data. Generally speaking,the model for the compressive strength does not perform as well as for the hardness.
3.2.2 ML by the SVM approach
Aside from the ANN processing,experimental results are analyzed using the SVM ML as well. Figures 9 and 10 are the corresponding results for the hardness and compressive strength,respectively. These figures indicate that:1)for the hardness property,SVM achieves an R2 value of 0.986 and an RMSE value of 0.632 for the training set,and 0.944 and 1.220 for the test set;2)for the compressive strength,SVM achieves an R2 value of 0.988 and an RMSE value of 5.051 for the training set,and 0.833 and 13.480 for the test set. Compared with the ANN approach,SVM presents a better capability in terms of data regression and prediction using the total 96 experimental datasets.
Figure 9.Prediction results of the SVM model for hardness of as-printed samples. (a), (b) Experimental values, predicted values and the corresponding R2 based on the training set; (c), (d) experimental values, predicted values and the corresponding R2 based on the test set
Figure 10.Prediction results of the SVM model for compressive strength of as-printed samples. (a),(b) Experimental values, predicted values and the corresponding R2 based on the training set; (c),(d) experimental values, predicted values and the corresponding R2 based on the test set
By selecting parameters shown in Table 3,the GA model has been run,and the results are shown in Fig. 11. From Fig. 11,one can note that the GA model converges around the 14th generation,and the optimal printing parameters predicted are:laser power P=1983.26 W,wire feeding speed vf=458.63 mm/min,scanning speed vs=40.48 mm/min,and height distance 1.31 mm. To feed the optimized parameters into the previously determined SVM model,predicted values of hardness and compressive strength are realized. The results are listed in Table 6,together with those determined from real experiments for comparison. From the table,it is noticed that the predicted values match well with the experimental values. Meantime,both the predicted and the actual results are among the best properties in comparison with the data in Table 5,suggesting the capability of the GA algorithm in forecasting optimized parameters for the LWAM experiments.
Figure 11.Objective function curves obtained using the GA approach
Regarding the SA approach,the optimization process is shown in Fig. 12. The corresponding optimized parameters are:laser power P=1847.95 W,wire feeding speed vf=467.01 mm/min,scanning speed vs=45.48 mm/min,and height distance 1.43 mm. By following a similar route as the GA approach,predictions have been made,and the values of hardness and compressive strength are determined. The results are listed in Table 7,together with those obtained from real experiments for comparison. From the table,it is noticed that the predicted values match well with the experimental values. Meantime,the predicted and actual results here are slightly worse than those predicted using the GA approach.
Figure 12.Objective function curve of the SA algorithm
In this study,algorithms of the ANN and SVM have been employed to regress performances of the as-printed Ti-6Al-4V prepared using LWAM,in terms of the hardness and compressive strength. Table 8 summarizes the effectiveness of these predictions achieved by our study,and those achieved by a few other studies[27-29]. It is shown that the regressions made by our study are with comparable accuracywith those published results. It indicates that the ANN and SVM algorithms can be used to study LWAM-prepared Ti materials like the Ti-6Al-4V alloy,whose further improvement in terms of prediction accuracy should be possible with increased number of experimental inputs. Future studies can also include application of interpretable models like,e.g.,SISSO,to solve the LWAM of metal materials,which are capable to provide direct mathematical relationships between experimental input and output properties[30]. Meantime,it is also noted that SVM shows a slightly better predication capability. This is due to the fact that ANN is often applied to a large amount of experimental data,while SVM is more suitable for a small amount of input data;people have also proposed that it may be also due to the too strong learning ability of the ANN approach,which,however,in turn,cannot reflect the hidden rules and may ultimately lead to a weakened prediction ability[31].
Table Infomation Is Not Enable
5 Conclusions
In this study,LWAM of the Ti-6Al-4V alloy wire has been studied,in both experimental and simulation ways. The relationship between processing parameters and mechanical properties is regressed using ANN and SVM. The most important findings are summarized as follows.
Single-track-multiple-layer samples have been printed using LWAM,after optimization from single-track-single-layer experiments. The samples show high relative density up to nearly 100% with virtually no pores in their microstructure. Compressive strength higher than 1600 MPa and microhardness higher than 380 HV have been achieved by the as-printed bulk samples.
Printing parameters as input and mechanical properties as output are fed to the ANN and SVM models for regression and prediction. Results show that the two ML models exhibit good regression capabilities with high values of the coefficient of determination(R2).
Predictions made by the GA and SA approaches have resulted in further improved hardness and compressive strength,which agree well with the experimental determination and show their capability to optimize properties of the LWAM-prepared Ti alloys.
[19] Jia L, Wu L. Optimization of process parameters affecting the quality of laser selective melting 3D printing[J]. Laser Journal, 42, 166-170(2021).
Junyi Wu, Bo Zhang, Weihua Wang, Weipeng Li, Xiyu Yao, Dawei Wang, Wei Xing, Ming Yan. Laser Wire Additive Manufacturing of Ti‑6Al‑4V Alloy and Its Machine Learning Study for Parameters Optimization (Invited)[J]. Chinese Journal of Lasers, 2024, 51(4): 0402305