• Acta Optica Sinica
  • Vol. 38, Issue 11, 1110002 (2018)
Wei Yi*, Yong Zeng, and Zheng Yuan
Author Affiliations
  • China Center for Resource Satellite Data and Applications, Beijing 100094, China
  • show less
    DOI: 10.3788/AOS201838.1110002 Cite this Article Set citation alerts
    Wei Yi, Yong Zeng, Zheng Yuan. Fusion of GF-3 SAR and Optical Images Based on the Nonsubsampled Contourlet Transform[J]. Acta Optica Sinica, 2018, 38(11): 1110002 Copy Citation Text show less
    Original images. (a) 3 m SAR image; (b) 16 m multi-spectral images; (c) 5 m SAR image; (d) 16 m multi-spectral image
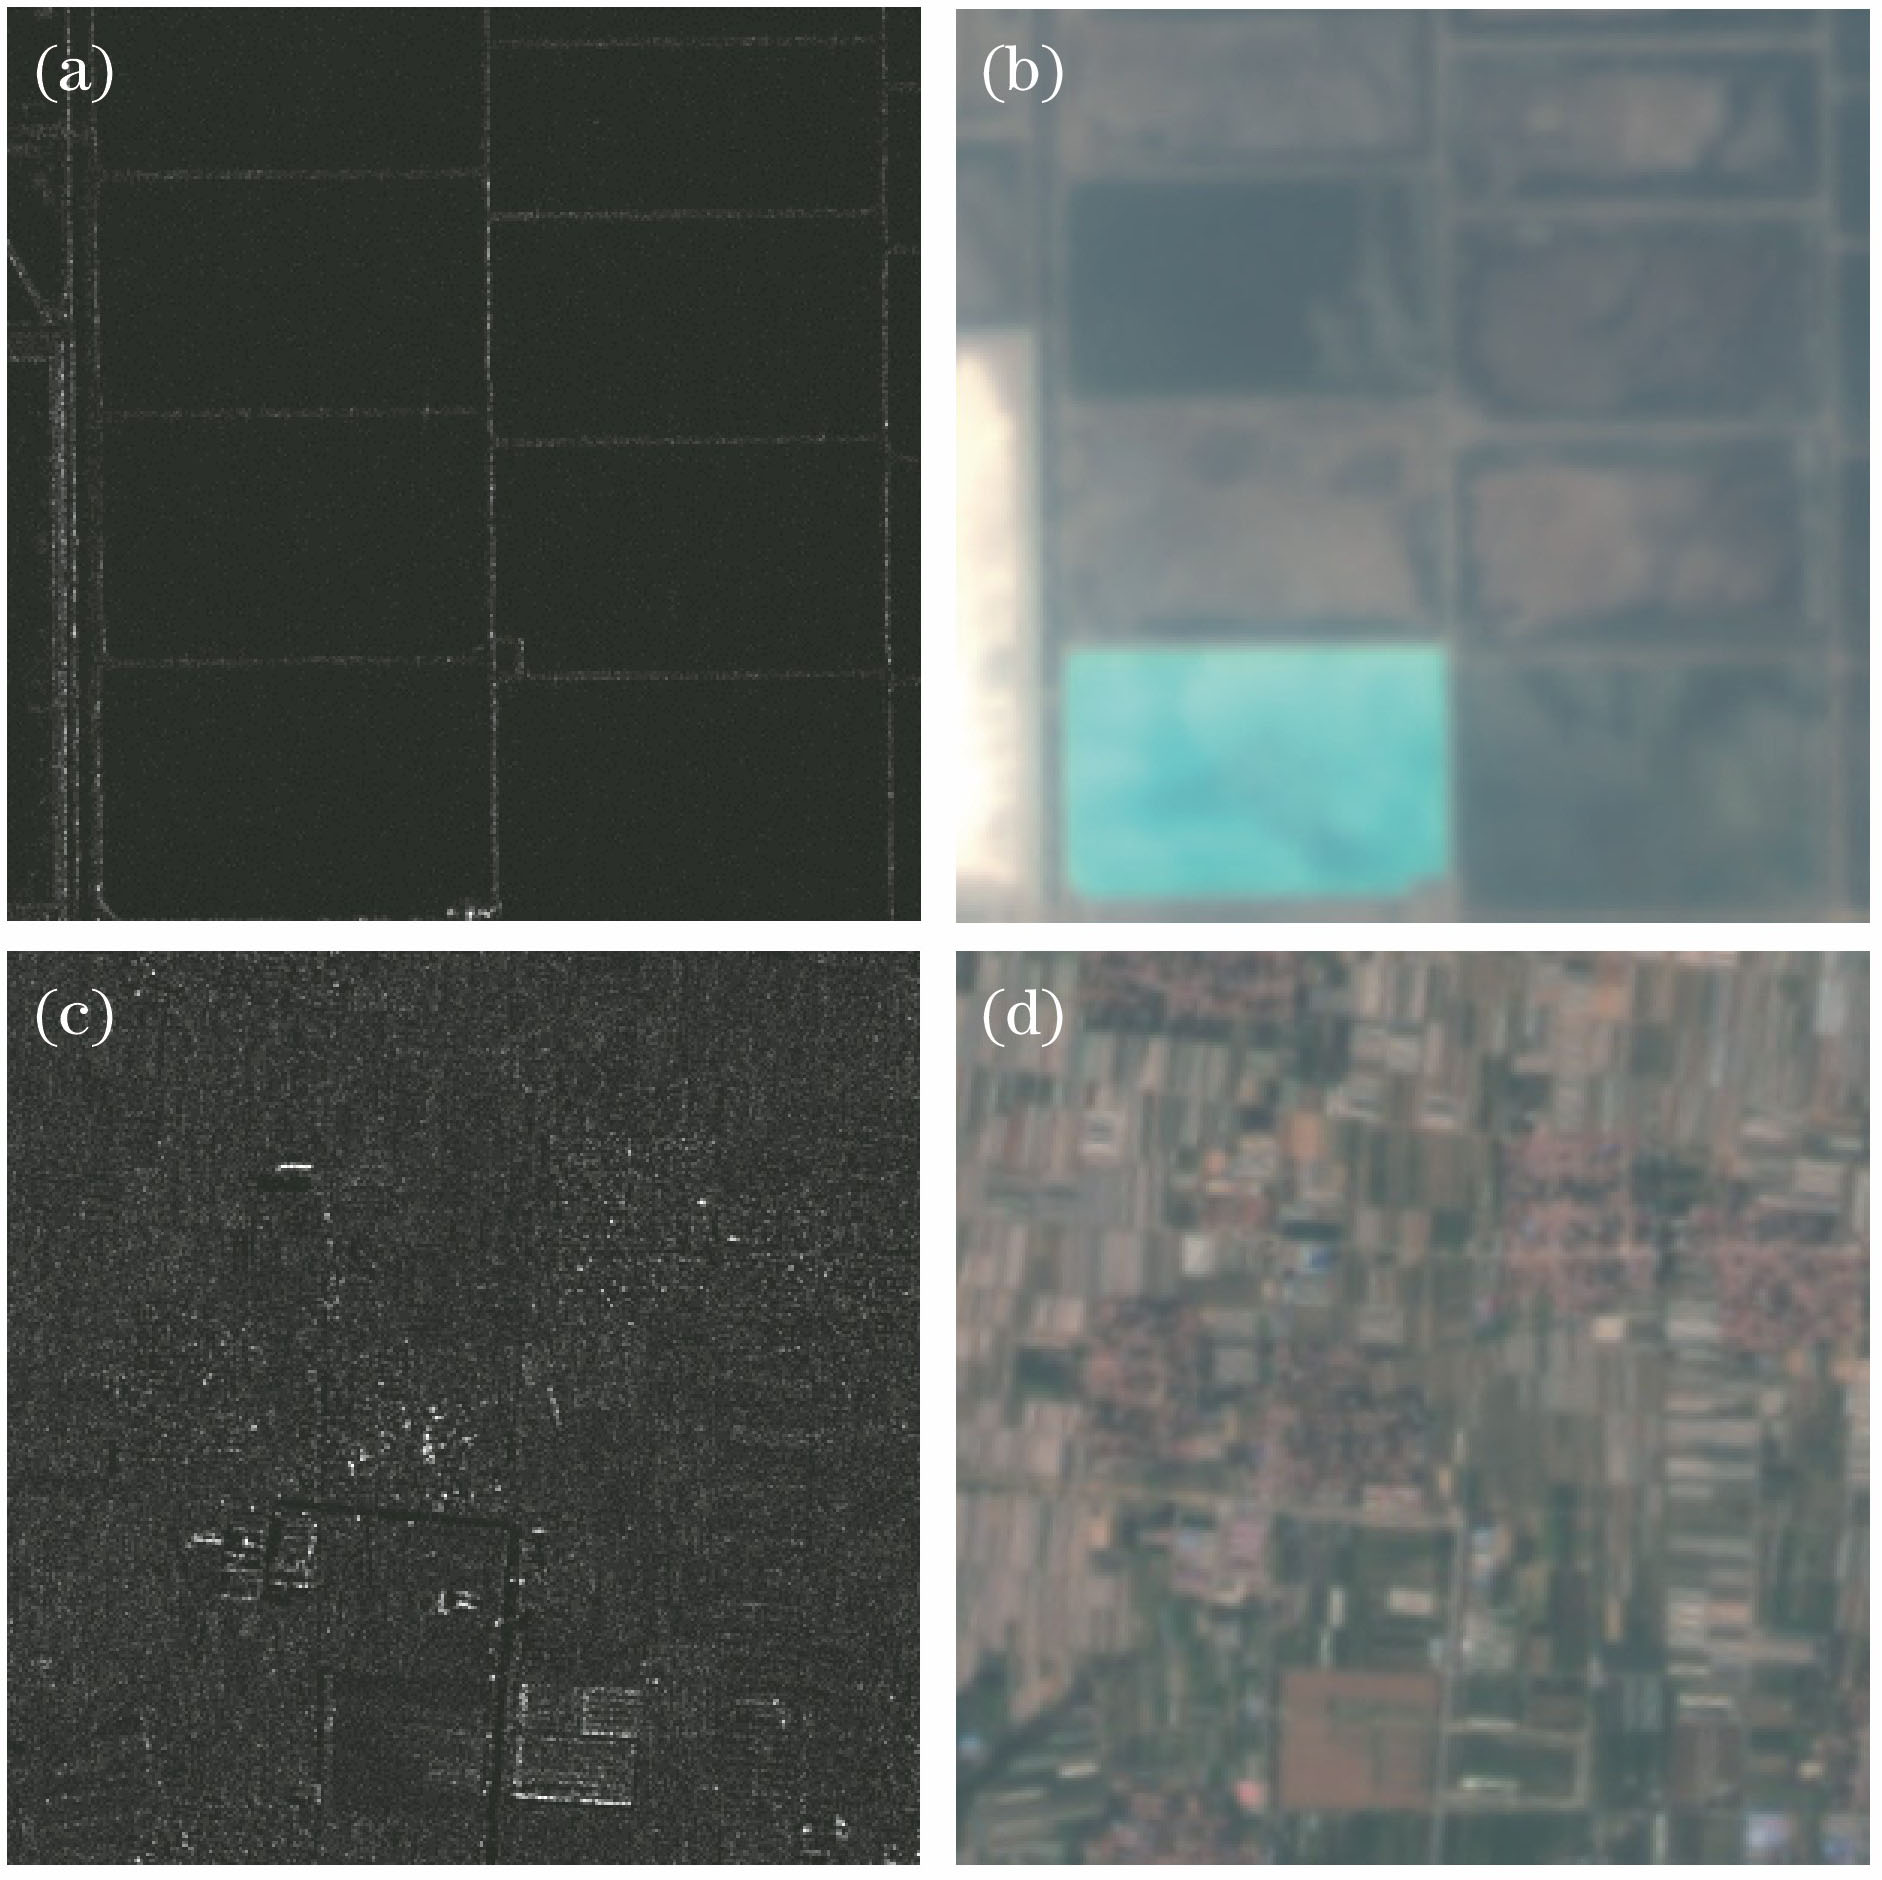
    Fig. 1. Original images. (a) 3 m SAR image; (b) 16 m multi-spectral images; (c) 5 m SAR image; (d) 16 m multi-spectral image
    Flow chart of the research process
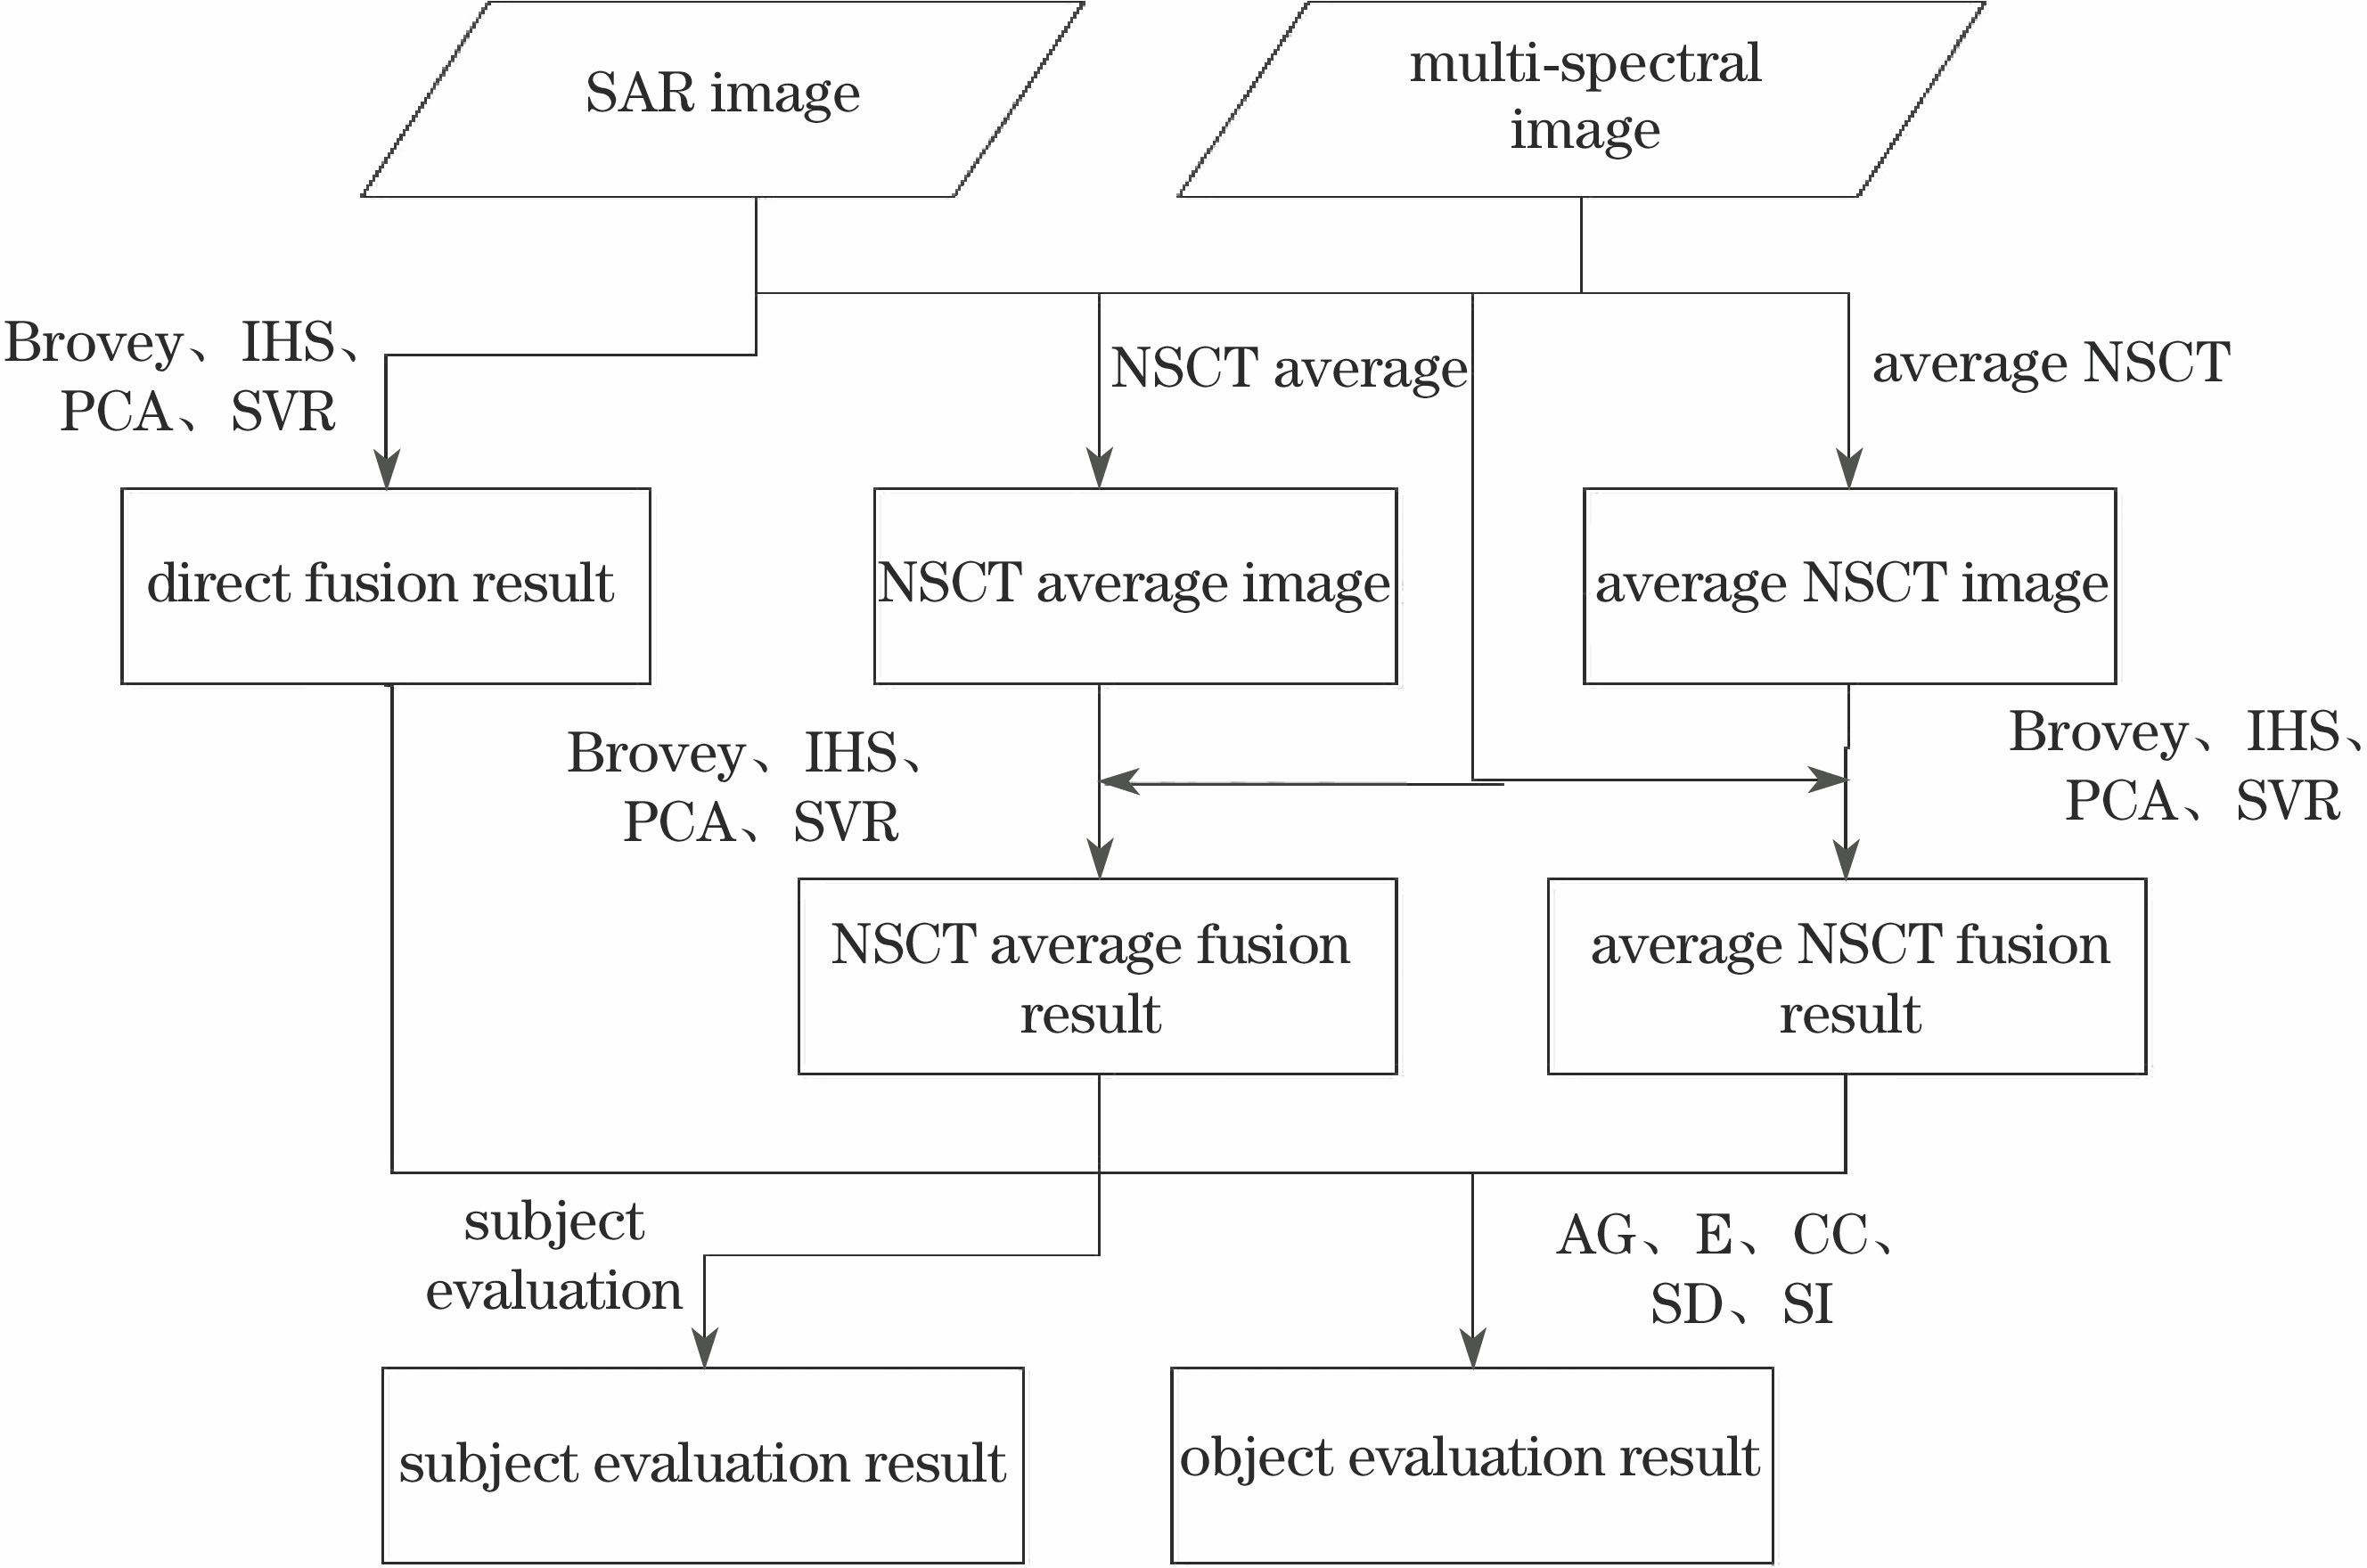
    Fig. 2. Flow chart of the research process
    Diagram of the NSCT filter structure
    Fig. 3. Diagram of the NSCT filter structure
    Average NSCT image simulation process
    Fig. 4. Average NSCT image simulation process
    NSCT average image simulation process
    Fig. 5. NSCT average image simulation process
    Fusion results of 3 m SAR and 16 m multi-spectral images. (a) Brovey-SAR; (b) IHS-SAR; (c) PCA-SAR; (d) SVR-SAR; (e) Brovey-average NSCT; (f) IHS-average NSCT; (g) PCA-average NSCT; (h) SVR-average NSCT; (i) Brovey-NSCT average; (j) IHS-NSCT average; (k) PCA-NSCT average; (l) SVR-NSCT average
    Fig. 6. Fusion results of 3 m SAR and 16 m multi-spectral images. (a) Brovey-SAR; (b) IHS-SAR; (c) PCA-SAR; (d) SVR-SAR; (e) Brovey-average NSCT; (f) IHS-average NSCT; (g) PCA-average NSCT; (h) SVR-average NSCT; (i) Brovey-NSCT average; (j) IHS-NSCT average; (k) PCA-NSCT average; (l) SVR-NSCT average
    Fusion results of 5 m SAR and 16 m multi-spectral images. (a) Brovey-SAR; (b) IHS-SAR; (c) PCA-SAR; (d) SVR-SAR; (e) Brovey-average NSCT; (f) IHS-average NSCT; (g) PCA-average NSCT; (h) SVR-average NSCT; (i) Brovey-NSCT average; (j) IHS-NSCT average; (k) PCA-NSCT average; (l) SVR-NSCT average
    Fig. 7. Fusion results of 5 m SAR and 16 m multi-spectral images. (a) Brovey-SAR; (b) IHS-SAR; (c) PCA-SAR; (d) SVR-SAR; (e) Brovey-average NSCT; (f) IHS-average NSCT; (g) PCA-average NSCT; (h) SVR-average NSCT; (i) Brovey-NSCT average; (j) IHS-NSCT average; (k) PCA-NSCT average; (l) SVR-NSCT average
    SatelliteImage typeResolution /mDateProduct level
    GF-3SAR32017-02-152
    GF-3SAR52017-08-282
    GF-1Multi-spectral162017-07-121
    Table 1. Data information
    IndexAGECCSDSI
    BroveySAR20.343.090.2226.570.52
    Average NSCT14.582.980.4121.970.80
    NSCT average3.904.290.983.694.45
    IHSSAR12.926.090.3024.860.94
    Average NSCT11.526.040.2425.420.65
    NSCT average3.175.880.8411.141.41
    PCASAR10.466.150.3921.781.14
    Average NSCT10.586.130.3122.810.88
    NSCT average2.625.880.8210.671.18
    SVRSAR48.257.310.3448.842.46
    Average NSCT8.176.510.889.335.01
    NSCT average4.226.270.983.836.76
    Table 2. Objective evaluation of 3 m SAR and 16 m multi-spectral image fusion
    IndexAGECCSDSI
    BroveySAR13.344.300.1515.260.57
    Average NSCT11.423.580.3212.831.00
    NSCT average7.654.230.767.033.51
    IHSSAR13.295.960.1615.350.80
    Average NSCT12.545.950.2813.861.53
    NSCT average7.485.880.796.795.14
    PCASAR13.535.900.0516.780.23
    Average NSCT11.235.850.2513.951.19
    NSCT average7.965.840.738.174.16
    SVRSAR34.137.230.2929.652.45
    Average NSCT19.296.600.4317.333.12
    NSCT average10.356.230.748.845.39
    Table 3. Objective evaluation of 5 m SAR and 16 m multi-spectral image fusion
    Wei Yi, Yong Zeng, Zheng Yuan. Fusion of GF-3 SAR and Optical Images Based on the Nonsubsampled Contourlet Transform[J]. Acta Optica Sinica, 2018, 38(11): 1110002
    Download Citation