• Chinese Optics Letters
  • Vol. 17, Issue 6, 060601 (2019)
Xiangchuan Wang, Shupeng Li, Xin Jiang, Jintao Hu..., Min Xue, Shangzhe Xu and Shilong Pan*|Show fewer author(s)
Author Affiliations
  • Key Laboratory of Radar Imaging and Microwave Photonics, Ministry of Education, Nanjing University of Aeronautics and Astronautics, Nanjing 210016, China
  • show less
    DOI: 10.3788/COL201917.060601 Cite this Article Set citation alerts
    Xiangchuan Wang, Shupeng Li, Xin Jiang, Jintao Hu, Min Xue, Shangzhe Xu, Shilong Pan, "High-accuracy optical time delay measurement in fiber link [Invited]," Chin. Opt. Lett. 17, 060601 (2019) Copy Citation Text show less
    Schematic diagram of a typical OTDR system. LD, laser diode; FUT, fiber under test; PD, photodetector.
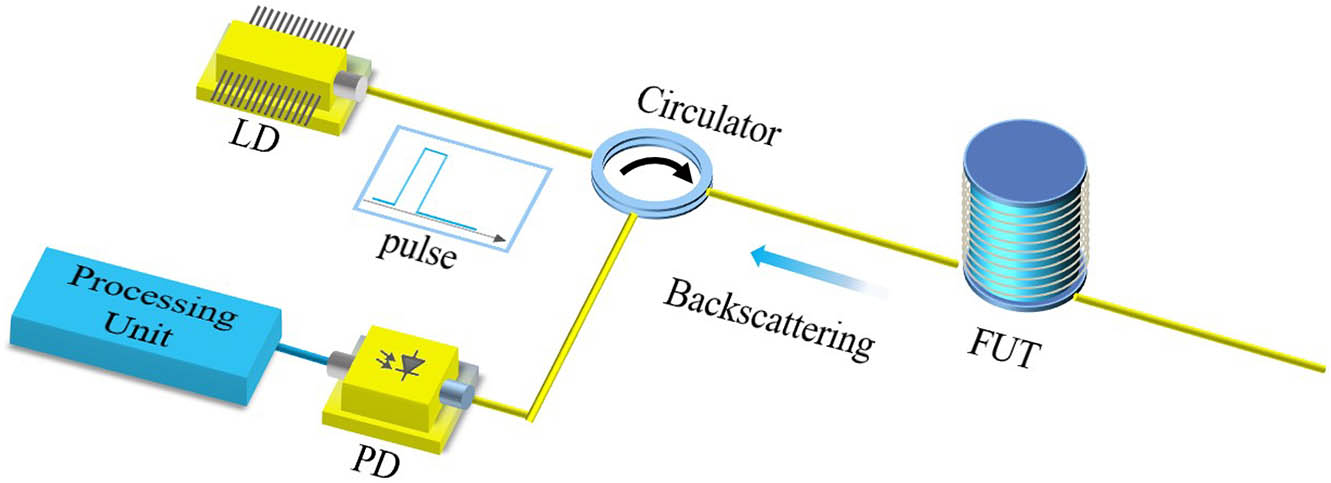
    Fig. 1. Schematic diagram of a typical OTDR system. LD, laser diode; FUT, fiber under test; PD, photodetector.
    Structure of the OFDR system. TLS, tunable laser source; OC, optical coupler.
    Fig. 2. Structure of the OFDR system. TLS, tunable laser source; OC, optical coupler.
    Configuration of an all-fiber mode-locked laser for the measurement of the fiber length. WDM, wavelength-division multiplexer.
    Fig. 3. Configuration of an all-fiber mode-locked laser for the measurement of the fiber length. WDM, wavelength-division multiplexer.
    Schematic diagram of the fiber transmission delay (FTD) measurement system. (a) FTD measurement loop. (b) System delay control (SDC) loop. TIC, time interval counter; VCO, voltage control oscillator; PLL, phase-locked loop; WDM, wavelength division multiplexer.
    Fig. 4. Schematic diagram of the fiber transmission delay (FTD) measurement system. (a) FTD measurement loop. (b) System delay control (SDC) loop. TIC, time interval counter; VCO, voltage control oscillator; PLL, phase-locked loop; WDM, wavelength division multiplexer.
    Schematic diagram of typical phase-derived range measurement system. RF, radio frequency.
    Fig. 5. Schematic diagram of typical phase-derived range measurement system. RF, radio frequency.
    Schematic diagram of the optical vector analyzer based on chirped optical double sideband (ODSB) modulation. MZM, Mach–Zehnder modulator; PMD, phase-magnitude detector.
    Fig. 6. Schematic diagram of the optical vector analyzer based on chirped optical double sideband (ODSB) modulation. MZM, Mach–Zehnder modulator; PMD, phase-magnitude detector.
    Schematic diagram of the optical microwave interferometer. MD, magnitude detector.
    Fig. 7. Schematic diagram of the optical microwave interferometer. MD, magnitude detector.
    CategoryMethodsMeasurement RangeResolution
    Time domainOTDR209.47 km20 m[17]
    10 km340 μm[22]
    100 km2 m[19]
    OTDR based on chaotic light25 km6 cm[24]
    300 m50 μm[26]
    Frequency domainOFDR35 m22 μm[47]
    151 km11.2 cm[33]
    40 kmSub-cm[34]
    Fiber laser100 km5 cm[12]
    100 km9 mm[13]
    Phase-locked loop50 km0.15 mm[14]
    Phase-derived rangingDirect phase-derived ranging2 kmSub-100 μm[15,37]
    Indirect phase-derived rangingTens of metersSub-mm
    Table 1. Comparison of the Measurement Systems
    Xiangchuan Wang, Shupeng Li, Xin Jiang, Jintao Hu, Min Xue, Shangzhe Xu, Shilong Pan, "High-accuracy optical time delay measurement in fiber link [Invited]," Chin. Opt. Lett. 17, 060601 (2019)
    Download Citation