• Chinese Optics Letters
  • Vol. 17, Issue 6, 060601 (2019)
Xiangchuan Wang, Shupeng Li, Xin Jiang, Jintao Hu, Min Xue, Shangzhe Xu, and Shilong Pan*
Author Affiliations
  • Key Laboratory of Radar Imaging and Microwave Photonics, Ministry of Education, Nanjing University of Aeronautics and Astronautics, Nanjing 210016, China
  • show less
    DOI: 10.3788/COL201917.060601 Cite this Article Set citation alerts
    Xiangchuan Wang, Shupeng Li, Xin Jiang, Jintao Hu, Min Xue, Shangzhe Xu, Shilong Pan. High-accuracy optical time delay measurement in fiber link [Invited][J]. Chinese Optics Letters, 2019, 17(6): 060601 Copy Citation Text show less

    Abstract

    Optoelectronic components and subsystems such as optically controlled phased array antennas, distributed radar networks, interferometric optical fiber hydrophones, and high-speed optoelectronic chips demand high-accuracy optical time delay measurement with large measurement range and the capability for single-end and wavelength-dependent measurement. In this paper, the recent advances in the optical time delay measurement of a fiber link with high accuracy are reviewed. The general models of the typical time delay measurement technologies are established with the operational principle analyzed. The performance of these techniques is also discussed.

    Optical time delay is an essential parameter in the generation, transmission, controlling, and processing of optical or microwave signals. Technologies for measuring the time delay in a fiber link with high precision are therefore critical for the development and fabrication of optoelectronic components and subsystems with high performance, such as optically controlled phased array antennas, distributed radar networks, interferometric optical fiber hydrophones, and high-speed optoelectronic chips[17]. For example, fiber-based signal distribution networks are widely used in the phased array radars and distributed radar networks. The time delay of each path in the optical distribution network should be carefully designed and precisely controlled. Otherwise, the efficiency of the array pattern synthesis or the signal-to-noise ratio (SNR) of the system would be deteriorated[2].

    Various optical time delay measurement technologies have been proposed and studied in the last decades, which can be generally divided into three categories: (1) the time domain measurement techniques, such as optical time domain reflectometry (OTDR), chaotic-light-based measurement, and optical femtosecond-pulse-based measurement[810]; (2) the frequency domain measurement techniques, such as optical frequency domain reflectometry (OFDR)[11], mode-locked laser repetition frequency measurement[12], free-running laser mode-spacing measurement[13], and phase-locked-loop-based measurement[14]; (3) the phase-derived range measurement, including direct phase-derived range measurement[15] and indirect phase-derived range measurement.

    In this paper, the optical time delay measurement techniques are overviewed and discussed with the emphasis on the operational principles and system architectures. In addition, the performance of these techniques is also summarized.

    1. TIME DOMAIN MEASUREMENT TECHNIQUES

    The methods in this category measure the parameter of time delay directly. Examples include OTDR, chaotic-light-based measurement, and optical femtosecond-pulse-based measurement.

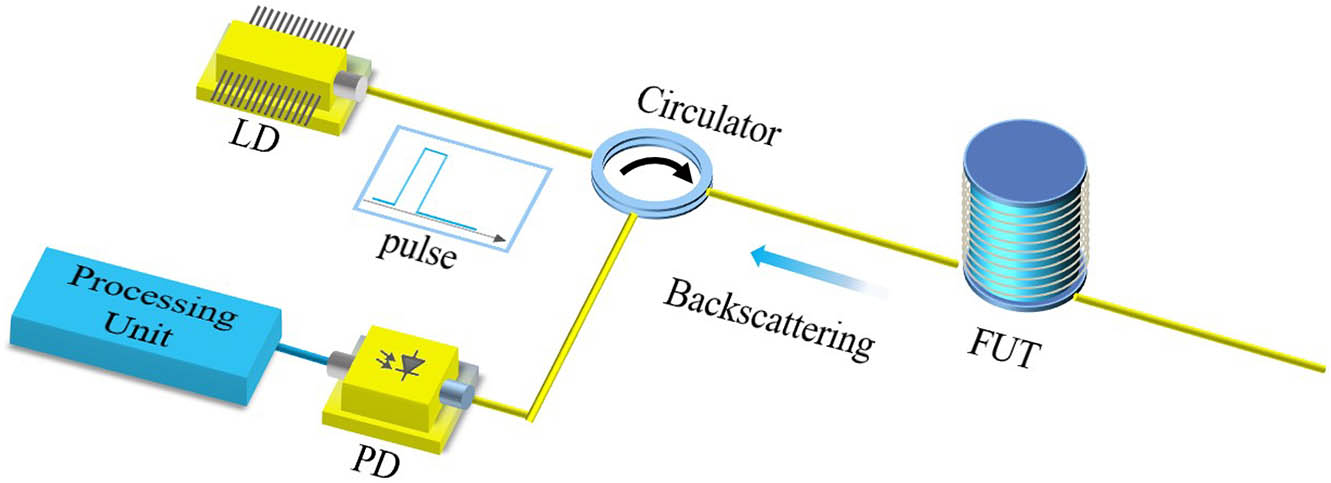
    The OTDR system is usually used as an instrument to characterize an optical fiber[16]. The parameters that can be extracted from an OTDR trace contain the fiber length, fiber attenuation, and fault location. Thus, time delay measurement is one of the basic functions of the OTDR system. The basic principle of an OTDR is the detection of the reflected or backscattered light in an optical fiber using a narrow pulse, which only requires access to one end of the fiber, as shown in Fig. 1. From the time-of-flight in the fiber, the distance along the fiber can be calculated by d=c2nΔt,where c is the speed of light, n is the refractive index of the fiber, and Δt is the round-trip transmission time.

    Schematic diagram of a typical OTDR system. LD, laser diode; FUT, fiber under test; PD, photodetector.

    Figure 1.Schematic diagram of a typical OTDR system. LD, laser diode; FUT, fiber under test; PD, photodetector.

    Until now, most research works on OTDR are focused on the improvement of the detection range and the spatial resolution. The detection range of the OTDR system mainly depends on the power of the laser, the reflectivity of the fiber, and the dynamic range and sensitivity of the photodetector (PD). However, due to the nonlinearity in the sensing fiber, it is impossible to further improve the power of the laser for long fiber measurement. As an alternative, the detection range of the OTDR system can be improved by enhancing the performance of the PD. For example, an OTDR system with a resolution of 20 m and a sensing distance up to 209.47 km is achieved using superconducting nanowire single-photon detectors (SNSPDs), which has ultrahigh sensitivity[17]. In addition, by improving the reflectivity of the fiber, the SNR of the OTDR system can also be improved. The SNR of the OTDR system is improved by 11 dB using the ultra-weak fiber Bragg grating (FBG)-based fiber whose reflectivity is about one order higher than the Rayleigh scattering[18]. Besides the traditional OTDR techniques, the Brillouin optical time domain analysis (BOTDA) is another hot topic in this area, which employs a pump light and a pulsed light simultaneously to improve the SNR of the system. A BOTDA system employing the second-order Raman amplification is proposed in Ref. [19], achieving a measurement range of 100 km and a resolution of 2 m. The measurement length can be further increased to 150.62 km with the spatial resolution of 9 m based on distributed Raman and Brillouin amplification[20].

    To improve the spatial resolution of the OTDR-based system, a narrower pulse is needed. Applying picosecond pulses, an OTDR system based on linear optical sampling is proposed to achieve a range of 100 m or 1.5 km with a spatial resolution of 620 μm or 1.3 cm[21]. However, due to the fiber dispersion, the width of the pulse would be broadened when the pulse travels along the long fiber. Using the dispersion compensation technique, a range of 10 km with a spatial resolution of 340 μm can be achieved[22]. In addition, based on phase-modulation correlation-domain analysis, a pseudo-random bit sequence can be used in the Brillouin distributed fiber sensing system, where a spatial resolution of 8.3 mm is demonstrated with a range of 17.5 km[23].

    Chaotic light can also be applied to improve the spatial resolution of the OTDR. The continuous chaotic light can be compressed into a pulse for accurate positioning utilizing the pseudo-random and spectral characteristics of the chaotic light. A resolution of 6 cm and a range of over 25 km can be realized using the broadband chaotic-light-based correlation OTDR (C-OTDR)[24]. The spatial resolution can be further improved to 2 cm using the wavelength tunable chaotic laser in Ref. [25], where the dynamic range of about 20.8 dB can be achieved. Researchers also proposed a method with a semiconductor optical amplifier ring structure to achieve a spatial resolution of about 50 μm and a dynamic range of 300 m[26].

    In addition to the OTDR-based time delay measurement, the excellent performance of ultrashort pulse lasers brings a precision improvement based on the time-of-flight measurement using a femtosecond pulse laser[10,2730]. In this type of technique, two pulse trains output from a femtosecond fiber laser are identical but with the polarizations orthogonal to one another. One pulse train is used as a reference pulse. The other is inserted into the path under test. By controlling the pulse repetition rate fr using the balanced optical cross-correlation signal as the feedback, the two pulse trains are precisely synchronized in the time domain. Then, the time-of-flight of the pulses under test can be expressed as tT=mts=m/fr,where m is the integer number and ts is the pulse separation. An Allan deviation of 117 nm can be achieved for the measurement of 0.7 km distance. The Allan deviation can be further reduced to 7 nm by increasing the averaging time. Although the experiments are realized in the air where the dispersion can be ignored, optical femtosecond-pulse-based measurement is also a potential high-accuracy time delay measurement technique for the fiber link, combining mature dispersion compensation techniques.

    2. FREQUENCY DOMAIN MEASUREMENT TECHNIQUES

    The frequency domain measurement techniques transform the length measurement into frequency measurement. Such methods mainly include OFDR, all-fiber mode-locked laser repetition frequency measurement, free-running laser mode-spacing measurement, and phase-locked-loop-based measurement.

    The principle of the OFDR system is shown in Fig. 2. A tunable laser is used to generate a frequency linearly swept light, which is divided into two bundles by a coupler. One branch of the light enters into the reference arm and is then reflected back to the coupler by a reflector. The other portion of the light enters into the test arm of the fiber under test (FUT). Then, the reference light interferes with the scattered light from the FUT. The beat frequency between the reference light and the test light can be used for length measurement, fIF=γΔLc/n,where γ is the sweep rate of the laser source and ΔL denotes the length difference.

    Structure of the OFDR system. TLS, tunable laser source; OC, optical coupler.

    Figure 2.Structure of the OFDR system. TLS, tunable laser source; OC, optical coupler.

    At the beginning, the OFDR system was proposed to detect the weak discrete reflection at the end of a 2.2 km long fiber[11]. Later, researchers focused on expanding the measurement range of the OFDR system. Using a highly coherent light source, the range of the OFDR system was firstly extended to 16.4 km with a spatial resolution of 100 m[31] and later extended to 30 km with a spatial resolution of 5 m[32]. Recently, new methods have been proposed to demonstrate an OFDR system with a high spatial resolution and a large measurement range. An incoherent OFDR system based on a Kerr phase interrogator was demonstrated, while a spatial resolution of 11.2 cm reflection detection was obtained as far as 151 km[33]. By using the phase-noise-compensated OFDR technique, a sub-centimeter (cm) spatial resolution over 40 km can be achieved[34].

    Another approach to measure the optical fiber length is based on a mode-locked fiber laser configuration, in which the time delay is locked to the repetition frequency of the mode-locked pulse[12]. Figure 3 shows an all-fiber mode-locked laser, where the FUT is a part of the laser cavity. The repetition frequency of the generated pulse can be given by v=qcnL,where q is an integer, so the length of the fiber can be obtained. In the experiment, a measurement range of 100 km with an effective spatial resolution of 5 cm is demonstrated[12].

    Configuration of an all-fiber mode-locked laser for the measurement of the fiber length. WDM, wavelength-division multiplexer.

    Figure 3.Configuration of an all-fiber mode-locked laser for the measurement of the fiber length. WDM, wavelength-division multiplexer.

    An all-fiber free-running laser can also be used for high-accuracy fiber length measurement. The FUT is used as a part of the fiber laser operating in the CW mode. The length of the fiber can be obtained by the measurement of the mode beating frequency. Base on this method, an accuracy of 10−8 for 100 km long fiber and an accuracy of 10−6 for a several-meters-long one are achieved[13].

    In addition to the techniques using an all-fiber laser, the phase-locked loop is also a promising solution for the measurement of optical fiber length. When the microwave signal is frequency-locked to the transmission delay, the time delay measurement can be implemented by a frequency measurement. Figure 4 shows the schematic diagram that consists of a fiber transmission delay (FTD) measurement loop and a system delay control (SDC) loop[14]. The precision of this system is mainly limted by the SDC loop, because compensating the system delay fluctuation by changing the temperature of the internal fiber will lead to uncertainty of 0.5 ps. To further reduce the system complexity, a new ambiguity resolving process is proposed, while the time interval counter (TIC) of the system can be removed[35]. Moreover, to overcome the disadvantage brought by the SDC loop, a self-calibrated configuration is used to remove the system delay fluctuation. Then, a sub-picosecond accuracy and an uncertainty of 0.2 ps are achieved[36].

    Schematic diagram of the fiber transmission delay (FTD) measurement system. (a) FTD measurement loop. (b) System delay control (SDC) loop. TIC, time interval counter; VCO, voltage control oscillator; PLL, phase-locked loop; WDM, wavelength division multiplexer.

    Figure 4.Schematic diagram of the fiber transmission delay (FTD) measurement system. (a) FTD measurement loop. (b) System delay control (SDC) loop. TIC, time interval counter; VCO, voltage control oscillator; PLL, phase-locked loop; WDM, wavelength division multiplexer.

    3. PHASE-DERIVED RANGE MEASUREMENT TECHNIQUES

    As the phase of the sinusoidal signal changes after the signal passes through the FUT, converting the length measurement to phase measurement is reasonable and effective[15,3746]. The phase-derived range measurement techniques can be classified into the direct measurement technique, which usually has a phase detector, and the indirect measurement technique.

    For the direct phase-derived range measurement technique, assuming the angle frequency of the sinusoidal signal is ω, the phase shift φ of the sinusoidal signal after passing through the FUT can be expressed as φ(ω)=ω·Δt,where Δt is the time delay of FUT.

    However, the single-frequency sinusoidal signal can only be used for range measurement within its period due to the integer ambiguity. To solve the problem, researchers usually use multiple frequency signals for range measurement. The range resolution is determined by the phase resolution of the largest frequency, and the measurement range is dependent on the minimum frequency or the frequency spacing.

    A schematic diagram of the phase-derived range measurement system is shown in Fig. 5. The RF signal is divided into two parts: one is used as the reference signal, and the other is the modulation signal. After passing through the FUT, the phase of the modulated signal will be changed, which is detected by a phase detector referenced by the original RF signal. There are many ways to realize this kind of measurement system. One typical solution is named the optical vector analyzer (OVA)[42].

    Schematic diagram of typical phase-derived range measurement system. RF, radio frequency.

    Figure 5.Schematic diagram of typical phase-derived range measurement system. RF, radio frequency.

    Figure 6 shows a typical phase-derived range measurement system based on the OVA. An RF signal and a DC bias signal are applied to a single-drive Mach–Zehnder modulator (MZM) under small signal modulation. A chirped optical double sideband (ODSB) signal is thus generated, which is used as the probe signal. After passing through the FUT, each wavelength component in the optical signal will be modified by the frequency response of the FUT. The signal is then sent to a PD, which generates a beating signal. Since the beating signal of the optical carrier and each sideband have the same frequency, the frequency response achieved by an electrical phase-magnitude detector (PMD) consists of the response information at both sidebands. To differentiate the frequency responses of the FUT carried by the two sidebands, two measurements with different bias points are needed. Because measurement errors of the phase are about 2°, the precision of the group delay measurement can reach the sub-picosecond level and that of the length measurement can reach tens of microns[15].

    Schematic diagram of the optical vector analyzer based on chirped optical double sideband (ODSB) modulation. MZM, Mach–Zehnder modulator; PMD, phase-magnitude detector.

    Figure 6.Schematic diagram of the optical vector analyzer based on chirped optical double sideband (ODSB) modulation. MZM, Mach–Zehnder modulator; PMD, phase-magnitude detector.

    In the early studies of the OVA, most systems are built based on swept-wavelength interferometry, which needs a tunable laser to generate the probe light. In order to correct the frequency inaccuracy caused by the nonlinearity in the optical frequency during the laser tuning, an auxiliary interferometer is also needed[43]. However, the path difference between the arms of the interferometers limits the time delay measurement range and the frequency resolution, which are typically 150 m and 200 MHz. Later, researchers focused on improving the frequency resolution of the OVA. The ultrahigh frequency resolution can greatly increase the time delay measurement range. Recent research shows that the ultrahigh-resolution OVA can have a phase resolution of 0.1° and a frequency resolution of less than 100 kHz. This allows for time delay measurement with a sub-picosecond resolution and a 2 km measurement range.

    In addition, Fig. 7 shows a microwave interferometric system that can be defined as the indirect phase-derived range measurement technique, where the broadband light source is used. The length difference between the FUT and the reference path can be achieved by observing the microwave interference fringes, which can be obtained by a magnitude detector. This method has a sub-millimeter (mm) spatial resolution because of the ultrahigh resolution of the magnitude detector. However, its measurement range is limited to about tens of meters.

    Schematic diagram of the optical microwave interferometer. MD, magnitude detector.

    Figure 7.Schematic diagram of the optical microwave interferometer. MD, magnitude detector.

    In summary, this paper provides an overview of the optical time delay measuring techniques developed over the past decades, with an emphasis on the principles and system architectures. The accuracy and range of the time delay measurement system based on time domain, frequency domain, and phase-derived range techniques are discussed and summarized in Table 1. In general, methods based on time domain are suitable to measure large time delays, but the typical resolution is low. Methods based on the frequency domain have a good performance in the measurement of medium amounts of time delay. Methods based on derived range techniques can simultaneously achieve an ultrahigh resolution and a large measurement range. The precision can reach tens of microns. The improvement of the performance of the optical time delay measurement technologies would greatly promote the development of the photonics-based radar, optical fiber hydrophones, and optoelectronic chips.

    CategoryMethodsMeasurement RangeResolution
    Time domainOTDR209.47 km20 m[17]
    10 km340 μm[22]
    100 km2 m[19]
    OTDR based on chaotic light25 km6 cm[24]
    300 m50 μm[26]
    Frequency domainOFDR35 m22 μm[47]
    151 km11.2 cm[33]
    40 kmSub-cm[34]
    Fiber laser100 km5 cm[12]
    100 km9 mm[13]
    Phase-locked loop50 km0.15 mm[14]
    Phase-derived rangingDirect phase-derived ranging2 kmSub-100 μm[15,37]
    Indirect phase-derived rangingTens of metersSub-mm

    Table 1. Comparison of the Measurement Systems

    References

    [1] J. Capmany, D. Novak. Nat. Photon., 1, 319(2007).

    [2] W. Ng, A. A. Walston, G. L. Tangonan, J. J. Lee, I. L. Newberg, N. Bernstein. J. Lightwave Technol., 9, 1124(1991).

    [3] A. M. Haimovich, R. S. Blum, L. J. Cimini. IEEE Signal Process. Mag., 25, 116(2008).

    [4] B. Culshaw, A. Kersey. J. Lightwave Technol., 26, 1064(2008).

    [5] V. R. Almeida, C. A. Barrios, R. R. Panepucci, M. Lipson. Nature, 431, 1081(2004).

    [6] S. Pan, D. Zhu, S. Liu, K. Xu, Y. Dai, T. Wang, J. Liu, N. Zhu, Y. Xue, N. Liu. IEEE Microwave Mag., 16, 61(2015).

    [7] F. Z. Zhang, Q. S. Guo, Z. Q. Wang, P. Zhou, G. Q. Zhang, J. Sun, S. L. Pan. Opt. Express, 25, 16274(2017).

    [8] X. Lu, S. Zhang, C.-G. Jeon, C.-S. Kang, J. Kim, K. Shi. Opt. Lett., 43, 1447(2018).

    [9] T.-A. Liu, N. R. Newbury, I. Coddington. Opt. Express, 19, 18501(2011).

    [10] J. Lee, K. Lee, S. Lee, S.-W. Kim, Y.-J. Kim. Nat. Photon., 4, 716(2010).

    [11] R. I. MacDonald. Appl. Opt., 20, 1840(1981).

    [12] Y. L. Hu, L. Zhan, Z. X. Zhang, S. Y. Luo, Y. X. Xia. Opt. Lett., 32, 1605(2007).

    [13] K. Yun, J. Li, G. X. Zhang, L. L. Chen, W. J. Yang, Z. G. Zhang. Opt. Lett., 33, 1732(2008).

    [14] J. W. Dong, B. Wang, C. Gao, Y. C. Guo, L. J. Wang. Opt. Express, 24, 1368(2016).

    [15] S. Liu, M. Xue, J. Fu, L. Wu, S. Pan. Opt. Lett., 43, 727(2018).

    [16] M. K. Barnoski, S. M. Jensen. Appl. Opt., 15, 2112(1976).

    [17] Q. Zhao, L. Xia, C. Wan, J. Hu, T. Jia, M. Gu, L. Zhang, L. Kang, J. Chen, X. Zhang, P. Wu. Sci. Rep., 5, 10441(2015).

    [18] X. Wang, Z. Yan, F. Wang, Z. Sun, C. Mou, X. Zhang, L. Zhang. IEEE Photon. J., 7, 6800511(2015).

    [19] S. Martin-Lopez, M. Alcon-Camas, F. Rodriguez, P. Corredera, J. D. Ania-Castañon, L. Thévenaz, M. Gonzalez-Herraez. Opt. Express, 18, 18769(2010).

    [20] H. Liang, W. Li, N. Linze, L. Chen, X. Bao. Opt. Lett., 35, 1503(2010).

    [21] S. Wang, X. Fan, Q. Liu, Z. He. Asia-Pacific Optical Sensors Conference, Th3A. 5(2016).

    [22] S. Wang, X. Fan, Z. He. IEEE Photon. J., 9, 6804710(2017).

    [23] A. Denisov, M. A. Soto, L. Thévenaz. Light: Sci. Appl., 5, e16074(2016).

    [24] A. Wang, Y. Wang. Sci. Chin. Inf. Sci., 53, 398(2010).

    [25] A. Wang, N. Wang, Y. Yang, B. Wang, M. Zhang, Y. Wang. J. Lightwave Technol., 30, 3420(2012).

    [26] Z. Xie, L. Xia, Y. Wang, C. Yang, C. Cheng, D. Liu. IEEE Photon. Technol. Lett., 25, 709(2013).

    [27] J. Kim, J. A. Cox, J. Chen, F. X. Kärtner. Nat. Photon., 2, 733(2008).

    [28] J. Ki-Nam, K. Yunseok, K. Seung-Woo. Opt. Express, 16, 19799(2008).

    [29] J. Lee, K. Lee, S. Lee, S. Kim, Y. Kim. Meas. Sci. Technol., 23, 207(2012).

    [30] T. Schibli, J. Kim, O. Kuzucu, J. Gopinath, S. Tandon, G. Petrich, L. Kolodziejski, J. Fujimoto, E. Ippen, F. Kaertner. Opt. Lett., 28, 947(2003).

    [31] K. Tsuji, K. Shimizu, T. Horiguchi, Y. Koyamada. IEEE Photon. Technol. Lett., 7, 804(1995).

    [32] K. Tsuji, K. Shimizu, T. Horiguchi, Y. Koyamada. J. Lightwave Technol., 15, 1102(1997).

    [33] C. Baker, Y. Lu, J. Song, X. Bao. Opt. Express, 22, 15370(2014).

    [34] X. Fan, Y. Koshikiya, F. Ito. Opt. Express, 19, 19122(2011).

    [35] J. Dong, B. Wang, C. Gao, L. Wang. Rev. Sci. Instrum., 87, 093102(2016).

    [36] H. Si, B. Wang, J. Dong, L. Wang. Rev. Sci. Instrum., 89, 083117(2018).

    [37] T. Niemi, M. Uusimaa, H. Ludvigsen. IEEE Photon. Technol. Lett., 13, 1334(2001).

    [38] M. Sagues, A. Loayssa. Opt. Express, 18, 17555(2010).

    [39] W. Li, W. T. Wang, W. H. Sun, L. X. Wang, J. G. Liu, N. H. Zhu. IEEE Photon. J., 6, 7900908(2014).

    [40] M. Xue, S. Pan, Y. J. Zhao. Opt. Lett., 39, 3595(2014).

    [41] T. Qing, S. Li, M. Xue, W. Li, N. Zhu, S. Pan. Opt. Express, 25, 4665(2017).

    [42] M. Xue, S. Liu, S. Pan. IEEE Photon. Technol. Lett., 30, 491(2018).

    [43] D. K. Gifford, B. J. Soller, M. S. Wolfe, M. E. Froggatt. Appl. Opt., 44, 7282(2005).

    [44] S. Pan, M. Xue. J. Lightwave Technol., 35, 836(2017).

    [45] T. Kawanishi, T. Sakamoto, M. Izutsu. IEICE Electron. Express, 3, 34(2006).

    [46] M. Xue, S. Pan, C. He, R. Guo, Y. Zhao. Opt. Lett., 38, 4900(2013).

    [47] B. Soller, D. Gifford, M. Wolfe, M. Froggatt. Opt. Express, 13, 666(2005).

    Xiangchuan Wang, Shupeng Li, Xin Jiang, Jintao Hu, Min Xue, Shangzhe Xu, Shilong Pan. High-accuracy optical time delay measurement in fiber link [Invited][J]. Chinese Optics Letters, 2019, 17(6): 060601
    Download Citation