• Chinese Optics Letters
  • Vol. 19, Issue 7, 071701 (2021)
Lijun Deng1, Qi Chen1, Yang Bai1、2, Guodong Liu2, Lüming Zeng1、2、*, and Xuanrong Ji1
Author Affiliations
  • 1State Key Laboratory of Precision Electronics Manufacturing Technology and Equipment, Guangdong University of Technology, Guangzhou 510006, China
  • 2Key Laboratory of Optic-Electronics and Communication, Jiangxi Science and Technology Normal University, Nanchang 330038, China
  • show less
    DOI: 10.3788/COL202119.071701 Cite this Article Set citation alerts
    Lijun Deng, Qi Chen, Yang Bai, Guodong Liu, Lüming Zeng, Xuanrong Ji. Compact long-working-distance laser-diode-based photoacoustic microscopy with a reflective objective[J]. Chinese Optics Letters, 2021, 19(7): 071701 Copy Citation Text show less

    Abstract

    Photoacoustic microscopy (PAM) has quickly developed into a noninvasive biomedical imaging technique to achieve detection, diagnosis, and monitoring. Compared with Q-switched neodymium-doped yttrium aluminum garnet or optical parametric oscillator lasers, a low-cost and small-size laser diode (LD) used as an alternative light source is conducive to achieving the miniaturization and integration for preclinical transformation. However, the LD’s low peak output power needs the high numerical aperture objective to attain tight focus, which limits the working distance (WD) of the system in only 2–3 mm, resulting in not achieving the backward coaxial confocal mode. Here, we present a compact visible LD-based PAM system with a reflective objective to achieve a 22 mm long WD and a 10 µm lateral resolution. Different depth subcutaneous microvascular networks in label-free mouse ears have successfully reappeared in vivo with a signal-to-noise ratio up to 14 dB by a confocal alignment. It will be a promising tool to develop into a handy tool for subcutaneous blood vessel imaging.

    1. Introduction

    Photoacoustic microscopy (PAM) is a hybrid biomedical imaging technology that has the capability of providing efficient optical contrast, utilizing a configuration of optical illumination and ultrasonic detection[1,2]. It has widely been exploited in dermatology[3,4], brain structure and function[5], and oral cavity[6], and gradually transforms to preclinical and clinical applications[710]. Conventionally, a photoacoustic excitation source generally comprises a Q-switched neodymium-doped yttrium aluminum garnet (Nd:YAG) laser or an optical parametric oscillator (OPO) tunable laser with short pulse duration and high pulse energy. This laser source is not practical and portable because of the expensive cost and large size and further increases the price and complexity of the photoacoustic system. In recent years, research hotspots are moving towards integration and miniaturization; a series of systems related to miniaturized PAMs have been reported[38]. Although these reported systems have achieved the miniaturization of the scanning part, the overall system structure is still bulky and not portable due to the photoacoustic excitation source. Therefore, to research the system with a small-size and low-cost light source for achieving overall system optimization and streamlining in low-resource environments has gained attention.

    With the advancement of semiconductor technology, the laser diode (LD) as an excitation source is conducive to achieving the miniaturization and integration of system light sources, which offers broad prospects because of its advantages such as small size, low cost, commercial availability, and stable performance[11]. At present, PAM systems based on a semiconductor light source have been successfully demonstrated for various applications, mainly including a mouse’s subcutaneous blood vessels[12,13], brains[14], human forearms[15], and fingers[16]. Up to now, some commercial pulsed LDs (100–400 W peak output power) operating in the near-infrared (NIR) region have been proved[11,13,17], and the peak output power of LDs in the visible (VIS) region is approximately three orders of magnitude less than that of NIR LDs, which provide only hundreds of milliwatts[18]. Therefore, the low peak output power of a pulsed LD needs the high numerical aperture (NA) objective to focus laser beams tightly for achieving sufficient energy density and generating effective photoacoustic signals, which limits the working distance (WD) in just 2–3 mm. Unfortunately, PAM needs to combine its optical and acoustic working pathways, which increases the engineering complexity of the optical-acoustic combination for an optimal signal-to-noise ratio (SNR). So far, the existing optical-resolution PAM (OR-PAM) system has two major methods to achieve the coaxial confocal mode[19,20], most commonly including a ring-shaped ultrasound transducer and a photoacoustic combiner. When using a photoacoustic combiner, a silicone oil layer or a thin aluminum coating sandwiched by two prisms plays an optical-acoustic reflecting part. However, the short WD of 2–3 mm will not only make the ultrasonic transducer work in the blind zone, but also result in no enough room for placing the photoacoustic combiner. To the best of our knowledge, the existing LD-based PAMs are all working in transmissive or obliquely incident modes, because the ultrasonic transducer cannot be directly positioned underneath the objective lens without blocking the optical focusing in this very short WD[1118,2125].

    A reflective objective lens is currently the most promising method to get a long WD[26,27], which is expected to alleviate the contradiction of WD at the expense of light energy loss. In this Letter, we present a VIS pulsed LD-based OR-PAM (LD-OR-PAM) system with a reflective objective (NA 0.3), which has a maximum variable WD up to 22 mm. The system utilizes a confocal alignment mode to optimize photoacoustic excitation and sensing efficiency. Blood vessels and capillaries in mouse ears were reconstructed in vivo, which has shown the potential of preclinical applications for subcutaneous blood vessels.

    2. Materials and Methods

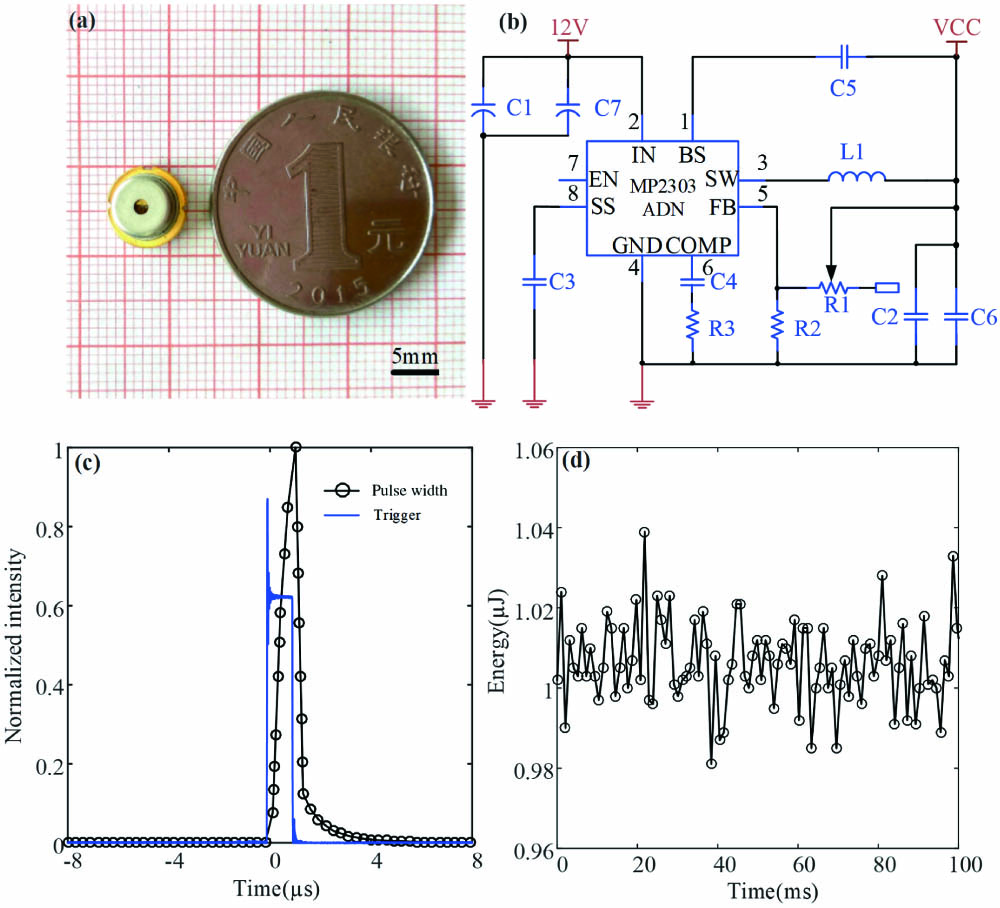
    To obtain a highly detectable photoacoustic signal, modulating the commercial LD [Fig. 1(a)] through driving circuits to get the pulse mode is necessary. In this paper, the pulse width modulation of the drive circuit is obtained by a built-in program single-chip microcomputer (STM32F405, STMicroelectronics) and an operational amplifier (LM358, National Semiconductor). The driving circuit of the LD is based on the principle of a constant current source circuit, and the voltage stabilizing circuit is composed mainly of a synchronous step-down voltage regulator (MP2303ADN, MPS) driven by STM32F405, as shown in Fig. 1(b). To get 10 V output, element parameters used in the drive circuit are C1C7=10µF, C2C6=0.1µF, C3=0.1µF, C4=3.3nF, C5=10nF, L1=15µH, R2=5.6kΩ, R3=10kΩ. The magnitude of the output voltage is determined by R2 and variable resistor R1. Figure 1(c) shows the pulse pattern of the LD measured by a photodetector (DET10A2, Thorlabs), which has a 120 ns delay between the trigger and pulse driving waveforms. The pulse width can be estimated by the full width at half-maximum (FWHM) to be about 650 ns. Figure 1(d) shows the LD pulse energy diagram within 100 ms measured by a power meter (1919-R, Newport), and the result demonstrates that single-pulse energy at the exit is about 1 µJ, and the power instability is less than 1.5%.

    (a) Photograph of the LD, (b) schematic diagram of the stabilization drive circuit of pulse LD, (c) measured pulse width of the LD where the trigger signal and pulse driving signal are delayed by 120 ns, and (d) exported energy stability test generated by each pulse of the excitation source.

    Figure 1.(a) Photograph of the LD, (b) schematic diagram of the stabilization drive circuit of pulse LD, (c) measured pulse width of the LD where the trigger signal and pulse driving signal are delayed by 120 ns, and (d) exported energy stability test generated by each pulse of the excitation source.

    Figure 2(a) shows the experimental configuration and schematic of the compact LD-OR-PAM system. The photoacoustic excitation source is a 450 nm LD with a pulse repetition frequency of 1 kHz. The pulsed beam from the LD, whose spot shape is a rectangle of 6mm×2mm and divergence angle is 3.0 mrad, is collimated by a collimating lens group. A reflective objective lens (LMM-15X-P01, Thorlabs) and a long focal length spherical plane-convex lens (GCL-010157, Daheng Optics) to realize distance adjustment are focused on the samples region. The focusing spot size has been evaluated by controlling the distance between the spherical lens and the reflective objective lens, which is simulated by the Zemax software in Fig. 2(b), and the maximum WD can reach 22 mm when the spherical lens and the reflective objective are in contact with each other in actuality. In the experiment, the distance of 3 mm is used, and a spot diameter of 7.56 µm can be considered as the lateral resolution. However, the axial resolution was 5.28 mm, as determined by the 250 kHz bandwidth in theory[28], which is at least three orders of magnitude more than the lateral resolution. Therefore, we choose to scan the focal area of the spot in the axial direction to achieve tomography imaging of different depths. Figure 2(c) is the amplitude of the collected A-line signals when the spot moves along the z axis with a step size of 1 µm. As can be seen from Fig. 2(c), the light absorption signal amplitude is about 20 µm, which is in the focal zone of the energy density distribution along the z axis.

    (a) The left is the photograph of system, and the right is the schematic diagram of the LD-OR-PAM system, (b) relationship of spot size and the distance between the reflective objective and spherical lens in the LD-OR-PAM system, and (c) the photoacoustic amplitude and energy density distribution of the sample absorption source along the z axis.

    Figure 2.(a) The left is the photograph of system, and the right is the schematic diagram of the LD-OR-PAM system, (b) relationship of spot size and the distance between the reflective objective and spherical lens in the LD-OR-PAM system, and (c) the photoacoustic amplitude and energy density distribution of the sample absorption source along the z axis.

    The LD-OR-PAM system uses a water-immersed ultrasonic transducer (N0.5P28L, DOPPLER) with a center frequency of 0.5 MHz and a 6dB bandwidth of 50% to receive photoacoustic signals in the forward position. In the experiment, the ultrasonic transducer and samples remain stationary, and the laser is irradiated to the sample surface through the reflective objective. The PAM system is driven by a stepper motor controller (GCD-040101M, Daheng Optics) to drive the translation stage (GCD-202050M, Daheng Optics) to scan, where the maximum speed of the translation stage can reach 23.7 mm/s. The photoacoustic signal received by the ultrasonic transducer was amplified by a 20 dB preamplifier (ZFL-500LN, Mini-Circuits) and a low-noise amplifier (5662, Olympus) with a gain of 54 dB. A low-pass filter (BLP-1.9+, Mini-Circuits) with a cut-off frequency of 1.9 MHz is used before the collected photoacoustic signal by a data acquisition card (PXIe-5105, National Instruments).

    3. Results

    To measure the lateral resolution of the LD-OR-PAM system experimentally, a sharp edge in a United States Air Force (USAF) resolution test target (GCG-02062, Daheng Optics) with pairs of longitudinal and lateral rectangular stripes with different sizes was divided into six groups with six element sizes. In this experiment, the imaged bars belonged to group 4 and element 1. Figure 3(a) presents photoacoustic reconstructed images of a USAF target, which is highlighted with a 2 µm step size. The geometric shape and relative position of the stripes on the USAF target could be reconstructed clearly by the LD-OR-PAM system. As shown in Fig. 3(b), the image at y=60µm and the edge spread function (ESF) are estimated by fitting the experimental data. The FWHM of the line spread function (LSF), which is the first derivative of the ESF, represents the lateral resolution quantified as 10 µm in this way. The resolution of the measurement here can be slightly different from the simulation results. We attempt to interpret these results; for instance, the installation and configuration of the system and the scanning process may affect the actual performance.

    (a) Reconstructed image of a USAF (4-1) and (b) assessed lateral resolution of the LD-OR-PAM system along the dotted line of (a).

    Figure 3.(a) Reconstructed image of a USAF (4-1) and (b) assessed lateral resolution of the LD-OR-PAM system along the dotted line of (a).

    To demonstrate the performance of the LD-OR-PAM system, a few irregularly arranged carbon fibers (diameter: ∼7 µm) used to simulate small capillary-sized blood vessels were imaged with a smaller field of view. The carbon fibers were suspended in the ultrasound gel and averaged 64 times with an optimized SNR in the experiment. Figure 4(a) shows the reconstructed image of carbon fibers with a step size of 3 µm. In order to calculate the SNR of the photoacoustic image, the area in the image that only contains background noise was selected to obtain averaged noise amplitude. It was observed that the position and profile of five carbon fibers can be clearly distinguished, and the effective photoacoustic signal has an upper SNR of 21 dB. Next, several black hairs were regularly arranged in a certain area with a step size of 50 µm. As is shown in Fig. 4(b), the structure of the hairs can be clearly presented, where the hairs’ breaking points are partly because of bubbles in the coupling fluid. The peak-to-peak SNR of the photoacoustic signal is about 17 dB. These results demonstrate that the LD-OR-PAM system has the capability of imaging tissue with biological light absorption.

    (a) Photoacoustic image of five carbon fibers and (b) photoacoustic image of crossed hair strands.

    Figure 4.(a) Photoacoustic image of five carbon fibers and (b) photoacoustic image of crossed hair strands.

    To further validate the label-free imaging feasibility of the system in vivo, we imaged subcutaneous microvascular networks in a mouse ear. Before the experiment, hairs of the mouse [Fig. 5(a)] were chemically depilated, and a thin layer of ultrasound gel was applied to the mouse skin. All animal experimental procedures were performed in accordance with the guidelines of the Guangdong University of Technology. The imaging area was 1.8mm×1.8mm with a scanning step size of 20 µm, and photoacoustic signals were averaged 64 times. Figure 5(b) shows the image of the distribution of blood vessels in the mouse ear, and the recorded SNR of 14 dB could be used for imaging. It was observed that pairs of accompanying arterioles labeled with arrows were imaged, whose detailed and further complicated branches could be clearly identified in Fig. 5(b). Moreover, small vessels were observed only in Fig. 5(b), such as the vessel labeled with the white arrow. By analyzing the vessel labeled with the white dotted line in Fig. 5(b), the branches of the major blood vessel are approximately 75 µm in diameter; the minimum blood vessels have a diameter of 17 µm, which are capillaries [Fig. 5(c)]. Figures 6(a) and 6(b) present additional examples of imaging at different scan depths in the same area of the mouse ear. After each layer of scanning is completed, the z axis advances by 30 µm. In Fig. 6(b), some capillaries become clearer, and other capillaries that do not appear in Fig. 6(a) are shown in a rectangular area. Therefore, scanning the focal area of the light spot in the axial direction can achieve different depth imaging in our LD-OR-PAM system.

    (a) Photograph of subcutaneous microvascular networks in a mouse ear, (b) the acquired 2D photoacoustic image of the subcutaneous microvascular structure in vivo, and (c) the vessel diameter at the dotted line in (b) is estimated.

    Figure 5.(a) Photograph of subcutaneous microvascular networks in a mouse ear, (b) the acquired 2D photoacoustic image of the subcutaneous microvascular structure in vivo, and (c) the vessel diameter at the dotted line in (b) is estimated.

    (a) Photoacoustic image of another subcutaneous microvascular structure and (b) photoacoustic image of the same area as in (a) but at different depths.

    Figure 6.(a) Photoacoustic image of another subcutaneous microvascular structure and (b) photoacoustic image of the same area as in (a) but at different depths.

    4. Conclusion

    Most VIS LDs currently provide a peak output power of only hundreds of milliwatts, which is about three orders of magnitude less than that of NIR LDs. Compared with other VIS LDs, the highest power available for a 450 nm commercial pulsed LD is about 2 W according to research. Using a 450 nm LD may potentially enhance the lateral resolution of the PAM system, and the absorption coefficient of hemoglobin in the VIS light band is several orders of magnitude higher than that in the NIR light band. Meanwhile, pulsed lasers are much more frequently used in PAM, mainly because the SNR of the photoacoustic signal in pulsed-laser excitation is greater than that in a continuous-wave laser. According to the maximum allowable contact limit of the American National Standards Institute[29], the maximum permissible exposure on the skin surface by pulsed laser is 31.2mJ/cm2(1.1×CA×t0.25J/cm2 within an exposure duration t between 100 ns and 10 s, where CA=1 for 400nm<λ<700nm). In the LD-OR-PAM system, the single-pulse energy on the sample surface was about 0.2 µJ with a laser duration of 650 ns. With in vivo animal experiments, assuming that the depth of the laser below the skin surface of mouse’s ear was about 200 µm, we calculated that the peak power density was 2.3×10³W/cm2, and the pulse energy density was 1.5mJ/cm2, which is an order of magnitude lower than the maximum safety threshold.

    In the experiment, the acquired data is averaged 64 times using a pulsed LD with 1 kHz repetition frequency and a PXIe-5105 data acquisition card, which can acquire 6–7 points per second. Scanning an area of 1.8mm×1.8mm with a 20 µm step size has a total of 8100 points, which takes roughly 23 min (8100/(6×60)=22.5min). The main limitations arise from the effect of the repetition frequency of the LD and the acquisition speed of the acquisition card. As a solution to increase the scanning speed, a two-dimensional micro-electromechanical system (MEMS) galvanometer can be used to realize automatic laser scanning[30]. Such a high-speed scanning galvanometer can be placed after the long focal length spherical plane-convex lens. Therefore, light will be scanned after the long focal length spherical plane-convex lens rather than inside it. What is more, the imaging speed can be further improved. The maximum pulse repetition rate of the LD is determined by its absolute maximum duty cycle of 0.1%. Therefore, at 10 ns pulse width, the repetition rate can be up to 100 kHz.

    As a possibility, a focused ring-shaped ultrasonic transducer used in a customized way that has a central hole is coaxially aligned with the plane-convex lens. Since the laser beam needs to pass through the hollow transducer, a larger spatial position is usually required to ensure that the beam is not blocked, which may cause a certain direction angle between excitation position of the photoacoustic signal and the receiving position of the transducer. The detection sensitivity of the hollow transducer decreases due to the large angle at which the photoacoustic signal is received. What is more, there is at least a 10% loss of acoustic energy due to a mismatch in the receiving angle and reduced acoustic focus due to the presence of the central hole[19]. The most significant drawback of a hollow transducer is that it is not commercially available. Compared with hollow transducers, three-dimensional (3D)-printed ultrasonic transducers have a wide range of applications, such as fast molding speed, high precision, moldless molding, low cost, and high efficiency.

    In summary, a compact VIS LD-OR-PAM system with a reflective objective to achieve a 22 mm long WD and a 10 µm lateral resolution is used. Different depth subcutaneous microvascular networks in label-free mouse ears have successfully reappeared in vivo with an acceptable SNR by confocal alignment. It will be a promising tool to develop into a handy tool for subcutaneous blood vessel imaging. Currently, the LD-OR-PAM system adopts the transmission mode, because the miniaturization of the low-frequency ultrasonic transducer is still an international problem in engineering, which is a trade-off between size and center frequency. We are trying to use a stereolithography technology[31] to fabricate a low-frequency micro-detector array of piezoelectric transducer (PZT) ceramics, which may realize a single element with a diameter of 1 mm and a height of 2 mm at a center frequency of 2.24 MHz[32]. The next work is about positioning the small transducer in the optically dark zone to allow convenient alignment without interference in reflection mode. There are still some issues to be addressed and optimized in the current study, for example, deformation of the embryoid body during the sintering process, difficulty of manufacturing a suitable backing layer, and trailing length of the signal frequency response. These technical problems still need to be resolved in the practical application. High-performance 3D-printed ultrasonic transducers can be fabricated by optimizing the manufacturing technique and parameters, such as the mass fraction ratio, sintering temperature, and material selection. On the other hand, combined with excellent achromatic performance of the reflective objective lens, several LDs at an ultrabroad spectral range could be used to achieve a label-free functional PAM of multiple endogenous absorption contrasts in vivo[15,26,33].

    References

    [1] J. Yao, L. Wang, J. M. Yang, K. I. Maslov, T. T. W. Wong, L. Li, C.-H. Huang, J. Zou, L. H. V. Wang. High-speed label-free functional photoacoustic microscopy of mouse brain in action. Nat. Methods, 12, 407(2015).

    [2] P. F. Hai, T. Imai, S. Xu, R. Y. Zhang, R. L. Aft, J. Zou, L. H. V. Wang. High-throughput, label-free, single-cell photoacoustic microscopy of intratumoral metabolic heterogeneity. Nat. Biomed. Eng., 3, 381(2019).

    [3] J. Kim, J. Y. Kim, S. Jeon, J. W. Baik, S.H. Cho, C. Kim. Super-resolution localization photoacoustic microscopy using intrinsic red blood cells as contrast absorbers. Light: Sci. Appl., 8, 103(2019).

    [4] W. Y. Zhang, H. G. Ma, Z. W. Cheng, Z. Y. Wang, K. D. Xiong, S. H. Yang. High-speed dual-view photoacoustic imaging pen. Opt. Lett., 45, 1599(2020).

    [5] J. B. Tang, X. J. Dai, H. B. Jiang. Wearable scanning photoacoustic brain imaging in behaving rats. J. Biophoton., 9, 570(2016).

    [6] T. Jin, H. Guo, H. B. Jiang, B. W. Ke, L. Xi. Portable optical resolution photoacoustic microscopy (pORPAM) for human oral imaging. Opt. Lett., 42, 4434(2017).

    [7] Q. Chen, H. Guo, T. Jin, W. Z. Qi, H. K. Xie, L. Xi. Ultracompact high-resolution photoacoustic microscopy. Opt. Lett., 43, 1615(2018).

    [8] P. Hajireza, W. Shi, R. J. Zemp. Real-time handheld optical-resolution photoacoustic microscopy. Opt. Express, 19, 20097(2011).

    [9] F. Duan, H. Ma, J. Zhang, S. Li, H. Li, Z. Wu, F. Hong, L. Zeng, L. Nie. Optical-resolution photoacoustic microscopy continually monitors macrophages activities of acute inflammation in vivo. Chin. Opt. Lett., 18, 121701(2020).

    [10] X. Wang, K. Xiong, X. Jin, S. Yang. Tomography-assisted Doppler photoacoustic microscopy: proof of concept. Chin. Opt. Lett., 18, 101702(2020).

    [11] L. Zeng, G. Liu, D. Yang, X. Ji. 3D-visual laser-diode-based photoacoustic imaging. Opt. Express, 20, 1237(2012).

    [12] H. T. Zhong, J. Y. Zhang, T. Y. Duan, H. R. Lan, M. Zhou, F. Gao. Enabling both time-domain and frequency-domain photoacoustic imaging by a fingertip laser diode system. Opt. Lett., 44, 1988(2019).

    [13] T. H. Wang, S. Nandy, H. S. Salehi, P. D. Kumavor, Q. Zhu. A low-cost photoacoustic microscopy system with a laser diode excitation. Biomed. Opt. Express, 5, 3053(2014).

    [14] P. K. Upputuri, M. Pramanik. Performance characterization of low-cost, high-speed, portable pulsed laser diode photoacoustic tomography (PLD-PAT) system. Biomed. Opt. Express, 6, 4118(2015).

    [15] A. Stylogiannis, L. Prade, A. Buehler, J. Aguirre, V. Ntziachristos. Continuous wave laser diodes enable fast optoacoustic imaging. Photoacoustics, 9, 31(2018).

    [16] W. Xia, M. K. A. Singh, E. Maneas, N. Sato, Y. Shigeta, T. Agano, S. Ourselin, S. J. West, A. E. Desjardins. Handheld real-time LED-based photoacoustic and ultrasound imaging system for accurate visualization of clinical metal needles and superficial vasculature to guide minimally invasive procedures. Sensors, 18, 1394(2018).

    [17] L. Zeng, G. Liu, D. Yang, X. Ji. Cost-efficient laser-diode-induced optical-resolution photoacoustic microscopy for two-dimensional/three-dimensional biomedical imaging. J. Biomed. Opt., 19, 076017(2014).

    [18] L. Zeng, Z. Piao, S. Huang, W. Jia, Z. Chen. Label-free optical-resolution photoacoustic microscopy of superficial microvasculature using a compact visible laser diode excitation. Opt. Express, 23, 31026(2015).

    [19] J. Yao, L. V. Wang. Sensitivity of photoacoustic microscopy. Photoacoustics, 2, 87(2014).

    [20] L. V. Wang, S. Hu. Photoacoustic tomography: in vivo imaging from organelles to organs. Science, 335, 1458(2012).

    [21] X. J. Dai, H. Yang, H. B. Jiang. In vivo photoacoustic imaging of vasculature with a low-cost miniature light emitting diode excitation. Opt. Lett., 42, 1456(2017).

    [22] M. Erfanzadeh, Q. Zhu. Photoacoustic imaging with low-cost sources: a review. Photoacoustics, 14, 1(2019).

    [23] S. K. Kalva, P. K. Upputuri, M. Pramanik. High-speed, low-cost, pulsed-laser-diode-based second-generation desktop photoacoustic tomography system. Opt. Lett., 44, 81(2019).

    [24] L. Zeng, G. Liu, D. Yang, X. Ji. Portable optical-resolution photoacoustic microscopy with a pulsed laser diode excitation. Appl. Phys. Lett., 102, 053704(2013).

    [25] Q. Yao, Y. Ding, G. Liu, L. Zeng. Low-cost photoacoustic imaging systems based on laser diode and light-emitting diode excitation. J. Innov. Opt. Health Sci., 10, 1730003(2017).

    [26] R. Cao, J. P. Kilroy, B. Ning, T. X. Wang, J. A. Hossack, S. Hu. Multispectral photoacoustic microscopy based on an optical–acoustic objective. Photoacoustics, 3, 55(2015).

    [27] H. Wang, X. Yang, Y. Liu, B. Jiang, Q. Luo. Reflection-mode optical-resolution photoacoustic microscopy based on a reflective objective. Opt. Express, 21, 24210(2013).

    [28] C. Zhang, K. Maslov, J. Yao, L. V. Wang. In vivo photoacoustic microscopy with 7.6-µm axial resolution using a commercial 125-MHz ultrasonic transducer. J. Biomed. Opt., 17, 116016(2012).

    [29] . ANSI Z136.1–2007: American National Standard for Safe Use of Lasers(2007).

    [30] M. Erfanzadeh, P. D. Kumavor, Q. Zhu. Laser scanning laser diode photoacoustic microscopy system. Photoacoustics, 9, 1(2018).

    [31] J. Cheng, Y. Chen, J.-W. Wu, X.-R. Ji, S.-H. Wu. 3D printing of BaTiO3 piezoelectric ceramics for a focused ultrasonic array. Sensors, 19(2019).

    [32] Y. Chen, X. Bao, C.-M. Wong, J. Cheng, H. Wu, H. Song, X. Ji, S. Wu. PZT ceramics fabricated based on stereolithography for an ultrasound transducer array application. Ceram. Int., 44, 22725(2018).

    [33] T. J. Allen, P. C. Beard. Dual wavelength laser diode excitation source for 2D photoacoustic imaging. Proc. SPIE, 6437, 64371U(2007).

    Lijun Deng, Qi Chen, Yang Bai, Guodong Liu, Lüming Zeng, Xuanrong Ji. Compact long-working-distance laser-diode-based photoacoustic microscopy with a reflective objective[J]. Chinese Optics Letters, 2021, 19(7): 071701
    Download Citation