
Xunyi Dai, Yi Tan, Ge Ren, Zongliang Xie. Analysis of Image Quality Detection Performance of Scanning Hartmann Technology[J]. Acta Optica Sinica, 2020, 40(7): 0712002
- Acta Optica Sinica
- Vol. 40, Issue 7, 0712002 (2020)
![Principle of Shack-Hartmann sensor[4]. (a) Spots of flat wavefront; (b) spots of wavefront with aberration](/richHtml/gxxb/2020/40/7/0712002/img_1.jpg)
Fig. 1. Principle of Shack-Hartmann sensor[4]. (a) Spots of flat wavefront; (b) spots of wavefront with aberration
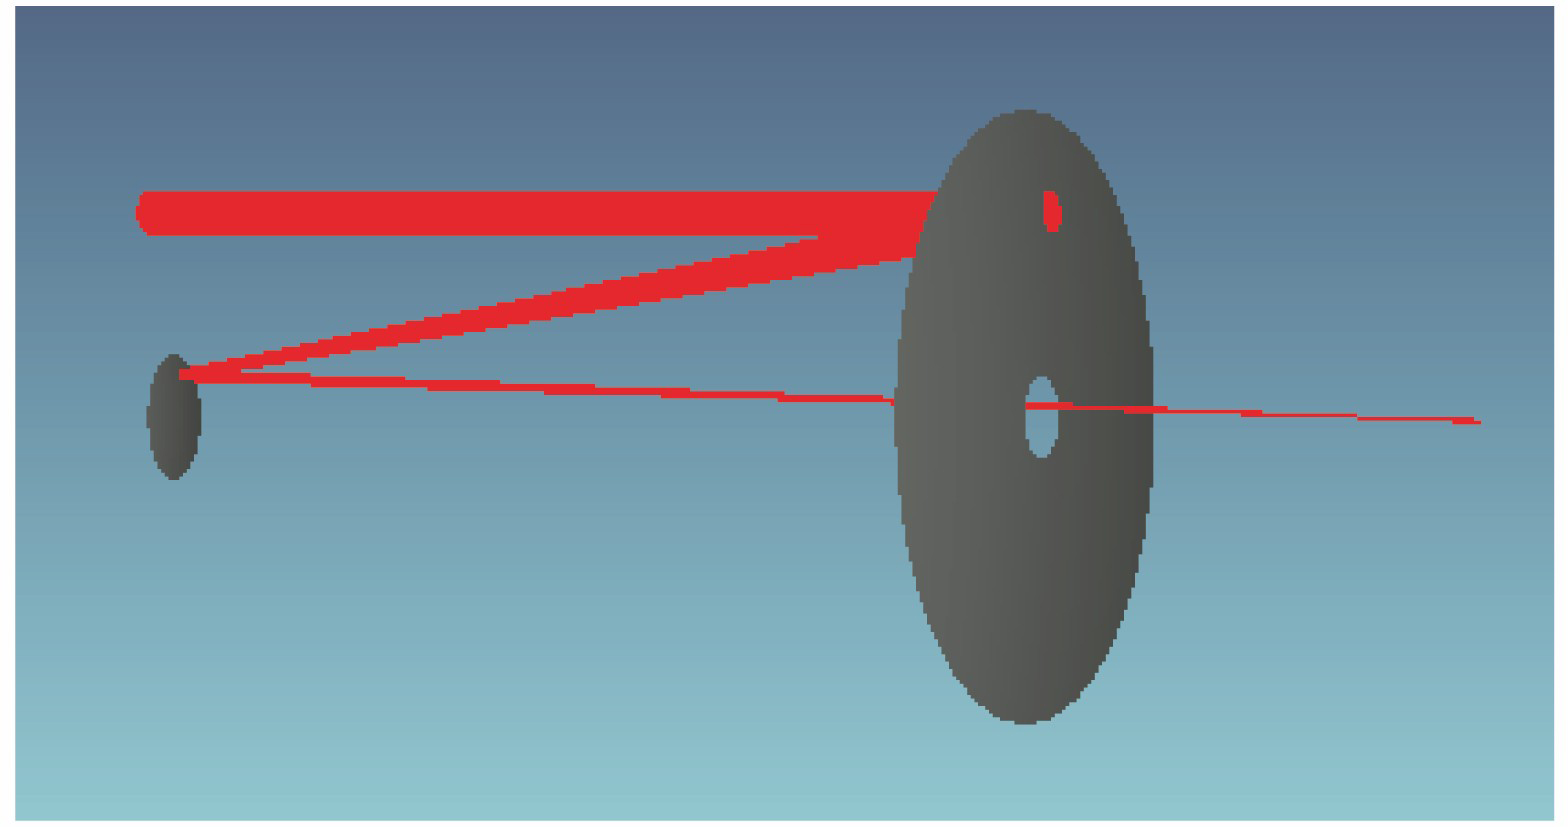
Fig. 2. Diagram of testing process of single sub-aperture
Fig. 3. Mirror area covered by sub-apertures
Fig. 4. Structure of Cassegrain system
Fig. 5. Initial aberration of the system
Fig. 6. Variation of RMS relative error with the order of aberration
Fig. 7. Recovery effect comparison of different order aberrations. (a) Recovery wavefront of the 8th-order aberration; (b) reference wavefront of the 8th-order aberration; (c) recovery wavefront of the 29th-order aberration; (d) reference wavefront of the 29th-order aberration
Fig. 8. Detection effect of low-order aberrations. (a) Reference aberration; (b) recovery aberration
Fig. 9. Detection results while adding high-order aberrations. (a) Recovery wavefront; (b) reference wavefront; (c) low-order residual; (d) high-order residual
Fig. 10. Three distribution types of sub-aperture. (a) Sparse sub-aperture distribution; (b) tangent sub-aperture distribution; (c) intensive sub-aperture distribution
Fig. 11. Recovery effect comparison of different sub-aperture distribution types. (a) Reference aberration introduced by the Zernike surface type; (b) recovery wavefront of sparse sub-aperture distribution; (c) recovery wavefront of tangent sub-aperture distribution; (d) recovery wavefront of intensive sub-aperture distribution
Fig. 12. Detection error curves under different sub-aperture numbers. (a) RMS relative error; (b) PV relative error
Fig. 13. Fitting curve of detection error with the number of sub-apertures

Set citation alerts for the article
Please enter your email address
© Copyright 2018-2021 | Chinese Laser Press. All Rights Reserved 沪ICP备15018463号-20