
Jongchan Park, David J. Brady, Guoan Zheng, Lei Tian, Liang Gao, "Review of bio-optical imaging systems with a high space-bandwidth product," Adv. Photon. 3, 044001 (2021)
- Advanced Photonics
- Vol. 3, Issue 4, 044001 (2021)
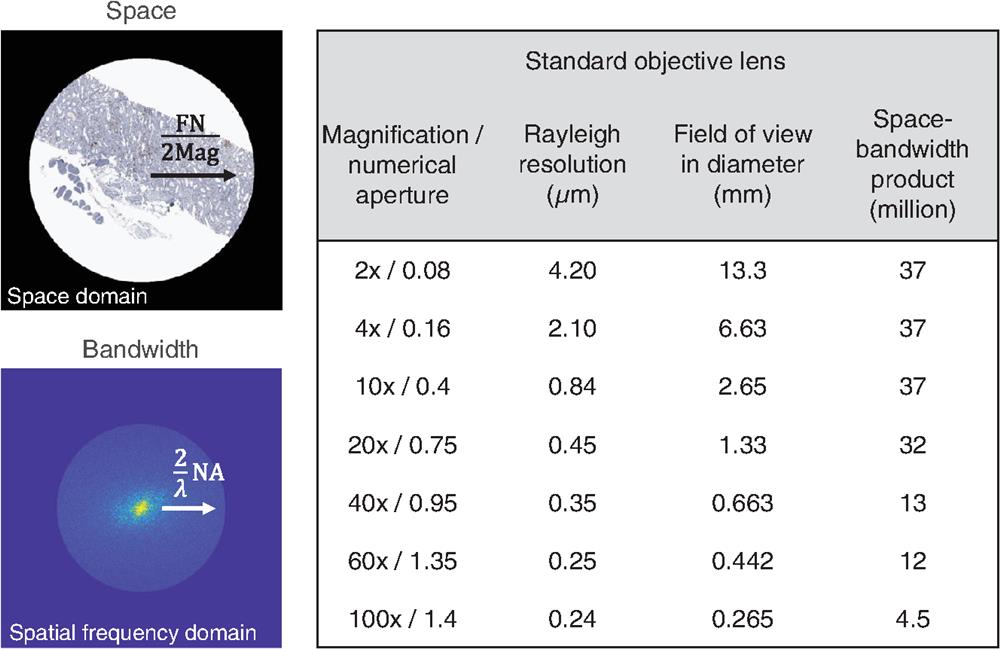
Fig. 1. The diffraction-limited SBP of standard microscope objective lenses at a 550 nm wavelength under incoherent illumination. The pathology slide image is modified from a public repository of image datasets (Image Data Resource).52,53
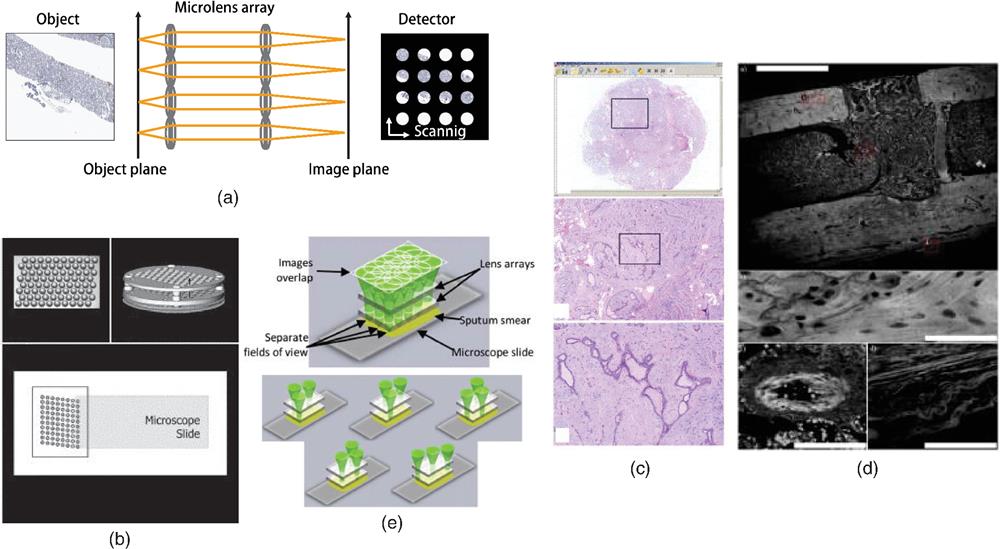
Fig. 2. Array microscopy. (a) Images are captured through parallelized microimaging systems. (b) Schematics of an array microscopy for digital histopathology. In their system, three lenslet arrays are stacked. Each lens group has a diameter of 1.5 mm and a working distance of
Fig. 3. Multiscale optical systems. (a) Illustration of multiscale optical designs. (b) Schematic of the AWARE-2 camera consisting of multiscale optics and 98 microcameras. (c) The camera captures a 0.96 gigapixel image. (d) Multiscale optical system for bioimaging. The system can track traces of GFP-labeled immune cells. The scale bars are 1000 and
Fig. 4. High-SBP imaging with Fourier ptychography. (a) Principles of spatial frequency-domain multiplexing. (b) Simplified diagram of a phase-retrieval algorithm. (c) Recovery of the spatially varying pupil function. (d) High-resolution Fourier ptychography image of red blood cells. Particles are shown in the zoom-in view of malaria-infected red blood cells (arrow). Panels (c) and (d) are modified from Refs. 79 and 80, respectively.
Fig. 5. Structured illumination microscopy. (a) Fourier domain representation of conventional, linear, and nonlinear structured illumination microscopy. In conventional microscopy, the measurable spatial frequency range is given as
Fig. 6. Hardware wavefront-engineering-based methods for high-SBP imaging. (a) System schematic of adaptive optical scanning microscopy. (b) The viewing location is given by the tilting angle of the galvanometric mirror, and the corresponding aberrations are corrected by the deformable mirror. (c) A bright-field image of a living C. elegans in a sub-FOV of the system. (d) Principles of high-resolution wide-FOV focusing with a disordered metasurface and wavefront shaping. (e) Scanning fluorescence microscopy with the metasurface. Immunofluorescence-labeled parasites (Giardia lamblia cysts) were imaged. The FOV and resolution are comparable to that of the
Fig. 7. Computational wavefront-engineering-based methods for high-SBP imaging. (a) Computational correction of aberrations in optical coherence tomography and interferometric synthetic aperture microscopy. (b) Computational correction of spatially varying aberrations of a wide-FOV objective lens (
Fig. 8. Illustration of various high-SBP imaging techniques. The pathology slide image is modified from a public repository of image datasets (Image Data Resource).52,53
Fig. 9. SBP of high-SBP imaging systems. We note that the cut-off spatial frequency of an incoherent imaging system is double that of the coherent imaging system given the same NA. All frequency-domain methods15,19,22,24 are coherent imaging methods. In this graph, the SBP values of objective lenses were calculated for incoherent imaging. For coherent imaging, the cut-off spatial frequency of the objective lenses will be halved. The number in the “Ref” column next to the author and year indicates the corresponding reference index.
|
Table 1. Comparative advantages of high-SBP imaging techniques. The FOV and temporal resolution of computational wavefront-engineering-based methods vary with the imager used. Therefore, we did not make conclusive comments.


Set citation alerts for the article
Please enter your email address

© Copyright 2018-2021 | Chinese Laser Press. All Rights Reserved 沪ICP备15018463号-20