Author Affiliations
1College of Engineering Science and Technology, Shanghai Ocean University, Shanghai 210306, China2College of Mechanical and Electrical Engineering, Shanghai Jian Qiao University, Shanghai 210306, China3Radiological Intervention Department, East Hospital of Shanghai Sixth People's Hospital, Shanghai 210306, Chinashow less
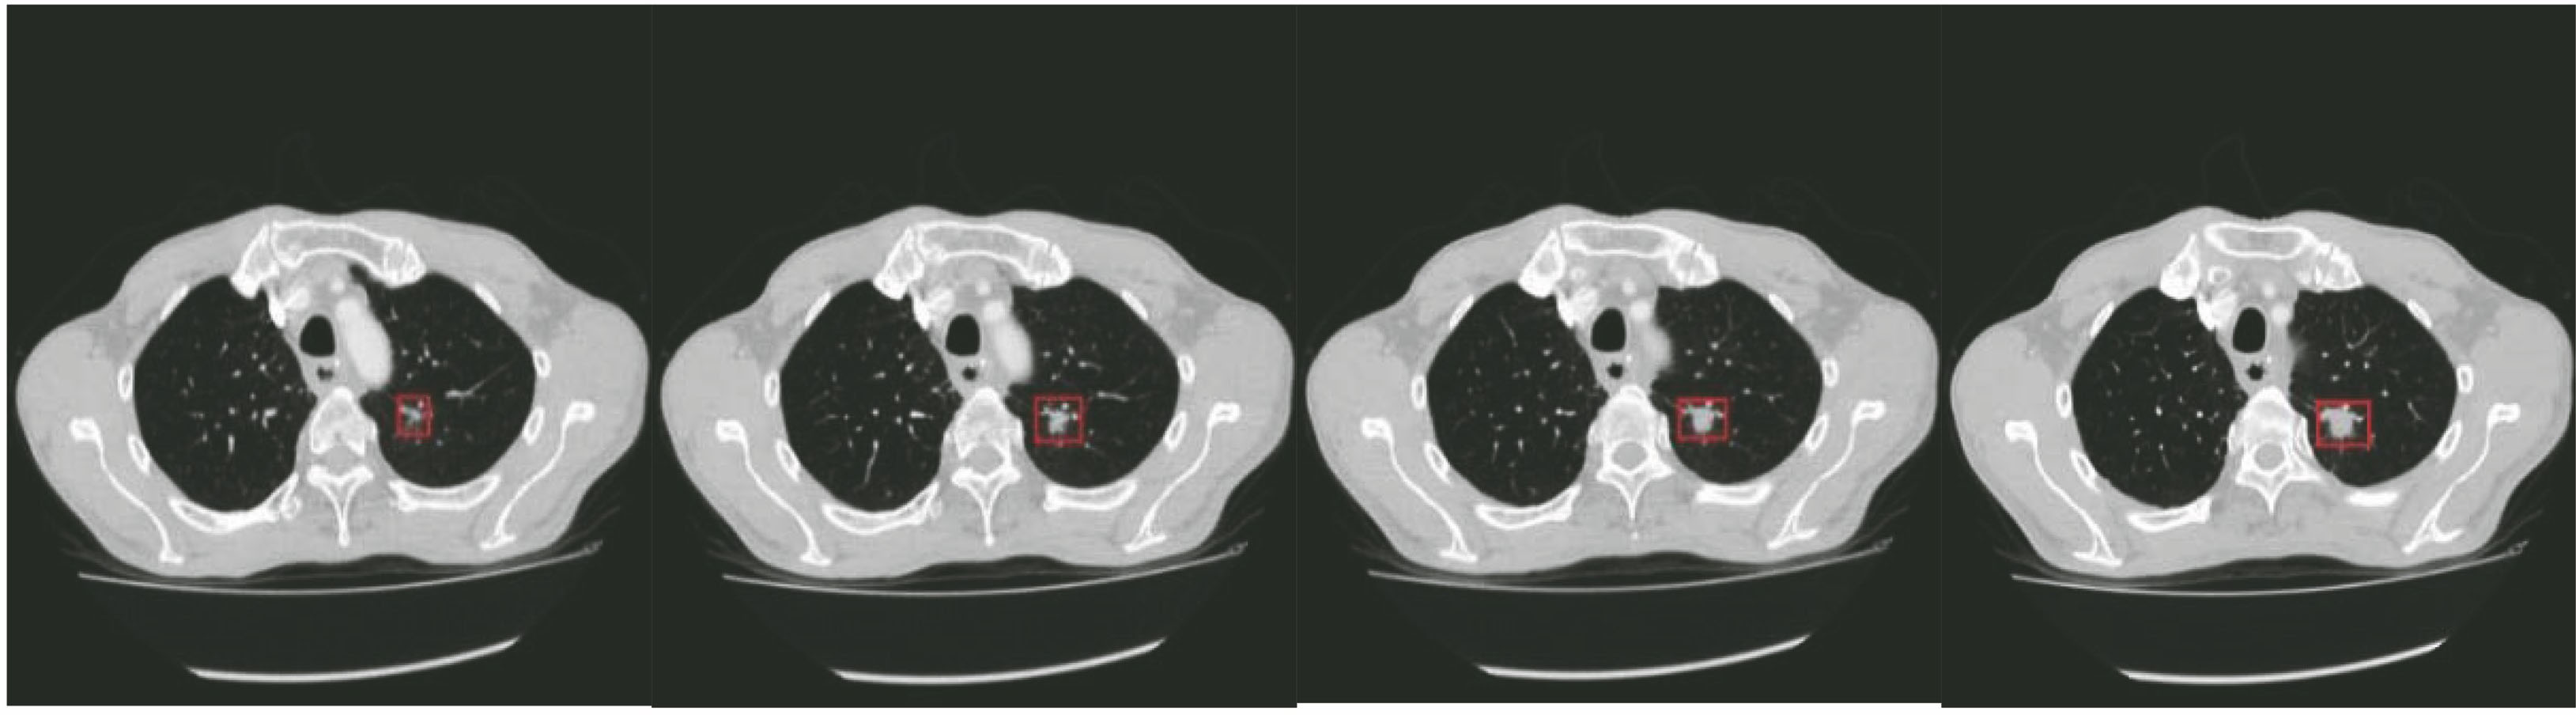
Fig. 1. CT images of lung
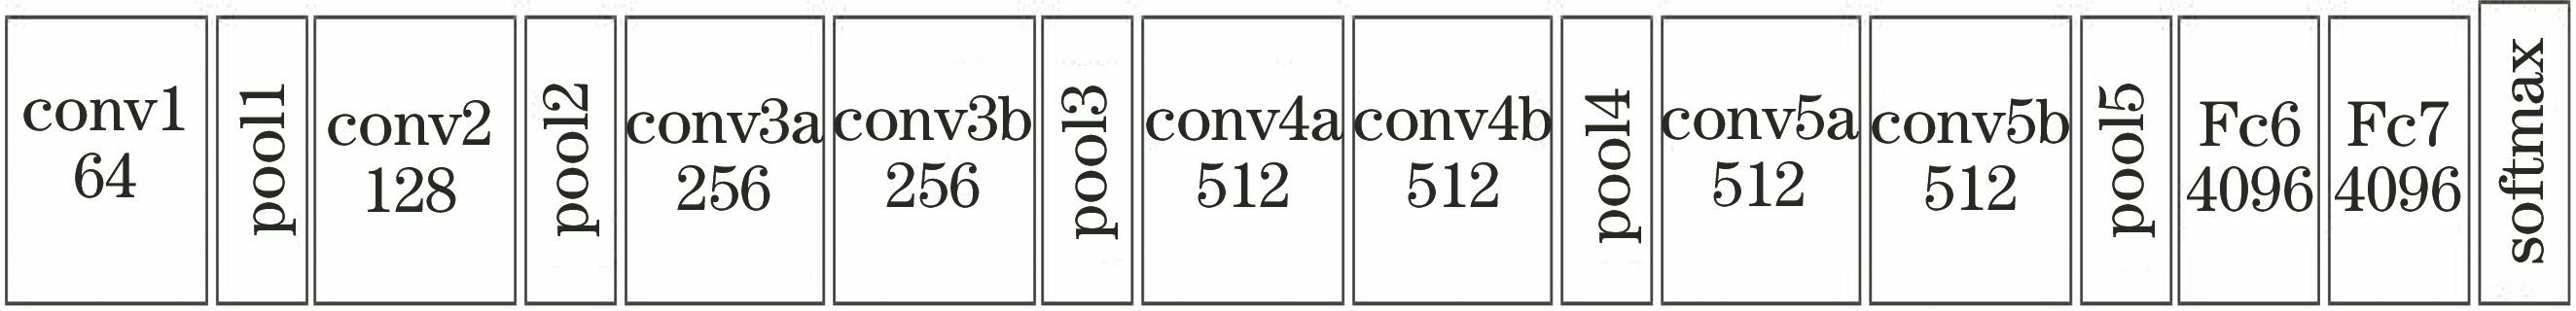
Fig. 2. Structure of C-3D convolutional neural network model
Fig. 3. Structures of 3D deformable convolution and pooling. (a) 3D deformable convolution; (b) 3D deformable pooling
Fig. 4. Structure of C-3D deformable convolutional neural network model
Fig. 5. Classification accuracy for different learning rates and optimization functions. (a) Experimental comparison of learning rate; (b) experimental comparison of optimization function
Fig. 6. ROC curves and PRC curves of different models. (a) ROC curves; (b) PRC curves
Fig. 7. Boxes of deformable convolution layers with different numbers of features. (a) Box of AUC; (b) box of F1; (c) box of P; (d) box of R
Fig. 8. Visualization results of convolution window pixel sampling. (a) Original labeled lung images; (b) original C-3D convolutional neural network; (c) improved C-3D convolutional neural network
Layer | F (number of convolutionalfeature maps)×S (kernal size) | Stride | Activation function | Output |
---|
3D conv1 | 16×(3×3×3) | 1×1×1 | ReLU | 32×32×32 | 3D conv2 | 64×(3×3×3) | 2×1×1 | ReLU | 16×32×32 | 3D pool1 | 64×(1×2×2) | 1×2×2 | — | 16×16×16 | 3D conv3 | 128×(3×3×3) | 1×1×1 | ReLU | 16×16×16 | 3D pool2 | 128×(2×2×2) | 2×2×2 | — | 8×8×8 | 3D conv4 | 256×(3×3×3) | 1×1×1 | ReLU | 8×8×8 | 3D pool3 | 256×(2×2×2) | 2×2×2 | — | 4×4×4 | 3D conv5 | 512×(3×3×3) | 1×1×1 | ReLU | 4×4×4 | 3D pool4 | 512×(2×2×2) | 2×2×2 | — | 2×2×2 | 3D conv6 | 64×(3×3×3) | 1×1×1 | ReLU | 1×1×1 | 3D conv7 | 1×(1×1×1) | 1×1×1 | Sigmoid | 1×1×1 | Fc (fully connected layer) | — | — | — | 1 |
|
Table 1. Setting of parameters of convolution layer and pooling layer in C-3D deformable convolutional neural network
Number | Name | Number ofsamples | Number ofpulmonarynodules |
---|
1 | LIDC-IDIR | 888 | 1186 | 2 | East Hospital of ShanghaiSixth People's Hospital | 300 | 346 | 3 | Hospital of KanghuaHaining Zhejiang | 200 | 212 |
|
Table 2. Dataset information
Model | AUC | R | P | F1 |
---|
C-3D | 0.9422±0.0105 | 0.9125±0.0131 | 0.9335±0.0135 | 0.8846±0.0036 | C-3D±DC | 0.9513±0.0127 | 0.9228±0.0158 | 0.9387±0.0101 | 0.8978±0.0097 | C-3D±DP | 0.9326±0.0241 | 0.8997±0.0179 | 0.9254±0.0157 | 0.8797±0.0103 | C-3D±DCP | 0.9575±0.0098 | 0.9183±0.0096 | 0.9413±0.0075 | 0.9067±0.0058 |
|
Table 3. Comparison of results of different convolutional neural network models
Model | R | P | F1 | AUC |
---|
C-3D+DCP,F:8 | 0.9131±0.0125 | 0.9226±0.0048 | 0.8948±0.0107 | 0.9394±0.0117 | C-3D±DCP,F:16 | 0.9183±0.0096 | 0.9413±0.0075 | 0.9067±0.0058 | 0.9575±0.0098 | C-3D±DCP,F:32 | 0.9253±0.0164 | 0.9534±0.0104 | 0.9286±0.0083 | 0.9617±0.0131 | C-3D±DCP,F:64 | 0.8957±0.0063 | 0.9113±0.0243 | 0.9024±0.0096 | 0.9339±0.0164 |
|
Table 4. Results comparison of different output features in C-3D deformable convolutional neural network
Model | AUC | P | R | F1 | Data |
---|
Ref. [6] | 0.8434 | 0.7444 | 0.7916 | 0.7673 | LIDC-IDRI | Ref. [7] | 0.9387 | 0.8750 | 0.9243 | 0.8990 | LIDC-IDRI | Ref. [8] | 0.8523 | 0.9045 | 0.9162 | 0.9103 | LIDC-IDRI | Proposed method | 0.9617 | 0.9534 | 0.9239 | 0.9286 | LIDC-IDRI | Proposed method | 0.9661 | 0.9613 | 0.9253 | 0.9378 | LIDC-IDIR+Local data |
|
Table 5. Comparison of different convolutional neural networks