
Di ZHANG, Maosong CHENG, Zhimin DAI, Chenglong SHI. Design and application of gamma radiation monitoring system based on LoRa[J]. NUCLEAR TECHNIQUES, 2023, 46(9): 090402
- NUCLEAR TECHNIQUES
- Vol. 46, Issue 9, 090402 (2023)
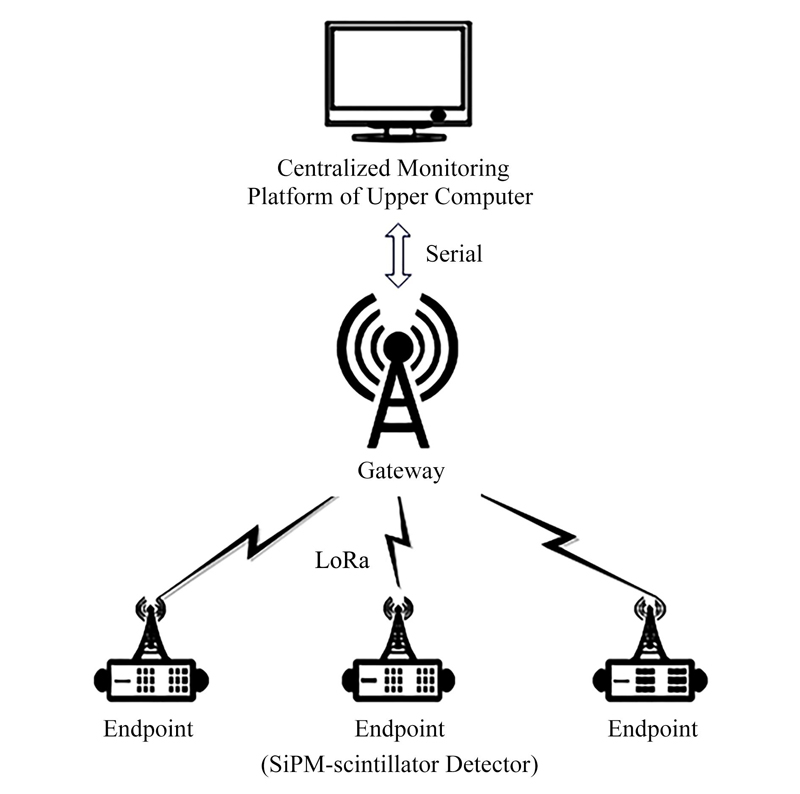
Fig. 1. Diagram of system structure

Fig. 2. Flow chart of terminal node and gateway communication process
Fig. 3. Flow chart of sending and receiving data of the gateway
Fig. 4. Schematic diagram of the internal principle of SiPM
Fig. 5. Physical drawing of JSP-TP6050-SMT
Fig. 6. Relationship between photon wavelength and detection efficiency
Fig. 7. KTY83/110 resistance change with temperature
Fig. 8. Temperature-compensated power supply circuit diagram
Fig. 9. Spectral curve of NaI energy resolution test
Fig. 10. Detection efficiency curve of NaI detextor
Fig. 11. Schematic diagram of relay node
Fig. 12. Signal strength comparison of node network access
Fig. 13. Relationship between counting rate and dose rate
Fig. 14. Display interface of the upper-computer centralized monitoring platform
|
Table 1. LoRa communication performance test results
|
Table 2. Communication distance was 1 000 m for the experimental data
|
Table 3. Results of air absorption dose rate measurement of ambient gamma radiation


Set citation alerts for the article
Please enter your email address

© Copyright 2018-2021 | Chinese Laser Press. All Rights Reserved 沪ICP备15018463号-20