
Hua Shen, Rihong Zhu, Yinxu Bian. Development and prospect of fiber grating in high-power continuous fiber laser[J]. Infrared and Laser Engineering, 2022, 51(2): 20210908
- Infrared and Laser Engineering
- Vol. 51, Issue 2, 20210908 (2022)
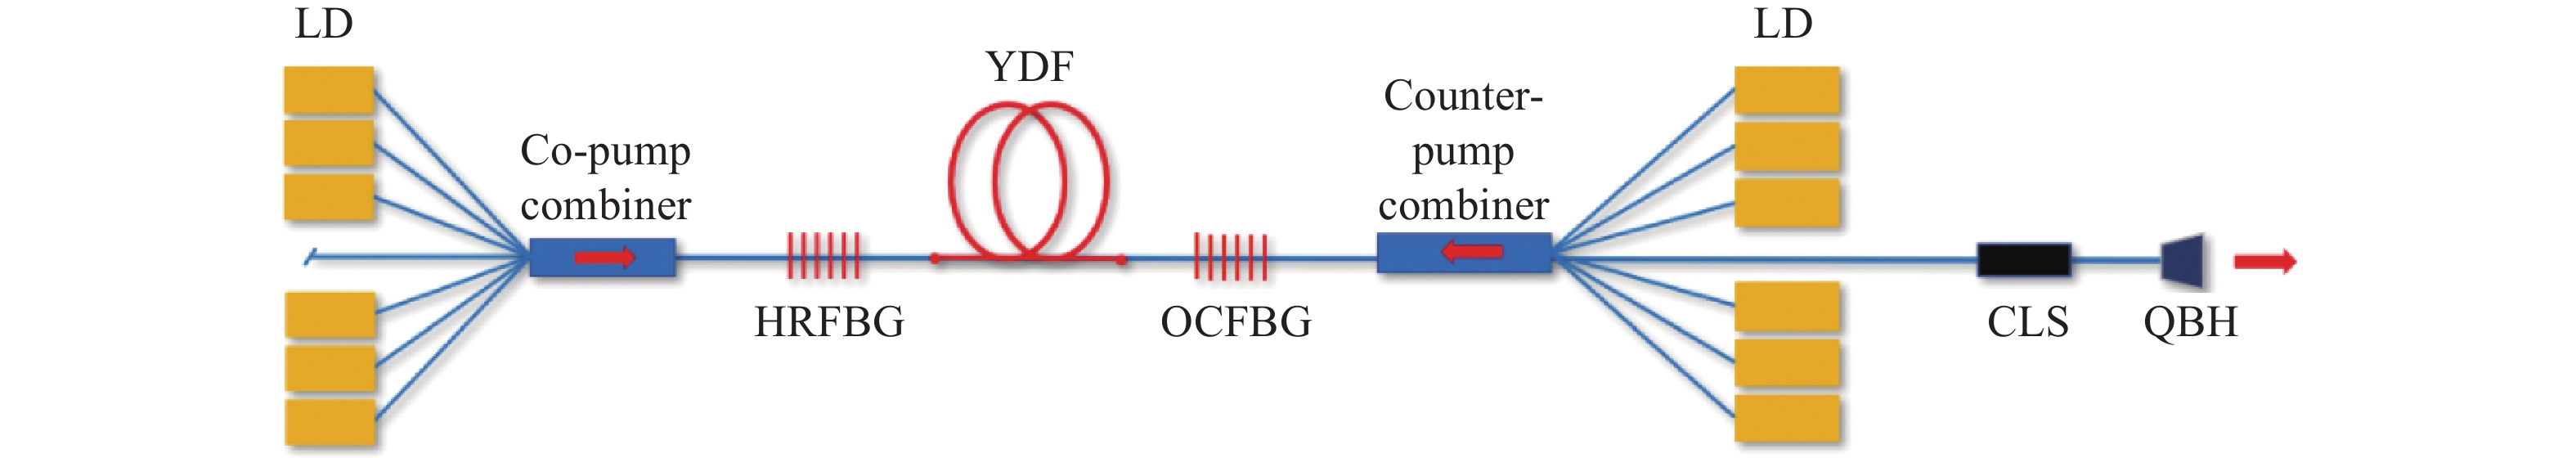
Fig. 1. Schematic diagram of fiber oscillator structure (LD: Laser diode, HRFBG: High reflector FBG, YDF: Ytterbium-doped fiber, OCFBG: Output-coupler FBG, CLS: Cladding light stripper, QBH: Quartz block head)
![(a) Schematic diagram of CTFBG structure; (b) Simulation of transmission spectra of TFBG and CTFBG with a tilt angle of 4°, and the chirp rate of CTFBG is 0.3 nm/cm[33]](/richHtml/irla/2022/51/2/20210908/img_2.jpg)
Fig. 2. (a) Schematic diagram of CTFBG structure; (b) Simulation of transmission spectra of TFBG and CTFBG with a tilt angle of 4°, and the chirp rate of CTFBG is 0.3 nm/cm[33]
Fig. 3. (a) Writing system based on ultraviolet pulse laser and phase mask; (b) CTFBG structure inside the fiber[35]
Fig. 4. With the increase of pump power, the output spectrum changes. (a) Spectrum before CTFBG is placed; (b) Spectrum after CTFBG is placed; (c) Comparison when the pump power is 3490 W[37]
Fig. 5. (a) Schematic diagram of the heating principle of the fiber coating at the inner end of the CTFBG cavity; (b) Thermal image of the CTFBG without cladding corrosion treatment; (c) Schematic diagram of the stepwise corrosion treatment of the CTFBG cladding; (d) Thermal image of CTFBG after cladding corrosion treatment[33]
Fig. 6. (a) Output spectrum before the system is connected to CTFBG; (b) Spectrum after the system is connected to CTFBG; (c) Difference between the SRS band spectra before and after CTFBG is added[33]
Fig. 7. (a) Schematic diagram of fiber SBS suppression experimental system based on TFBG; (b) SBS suppression effect based on TFBG[41]
Fig. 8. (a) Schematic diagram of LPFG structure; (b) LPFG simulation transmission spectrum[44]
Fig. 9. Using LPFG to achieve suppression of SRS effect in double-clad pulsed fiber lasers[46]
Fig. 10. Output spectra of the MOPA system. (a) Without and (b) with the 14/250 LPFG; (c) Difference between the output spectra of the system with and without the 14/250 LPFG[44]
Fig. 11. Evaluation system of SRS in LPFG suppression oscillator[47]
Fig. 12. Structure of PS-LPFG and the principle of suppressing laser spectral broadening[16]
Fig. 13. (a) PS-LPFG system based on point-by-point scanning technology; (b) PS-LPFG spectrum produced[16]
Fig. 14. (a) High-power MOPA system used to evaluate the performance of suppressing spectral broadening; (b) System output spectrum before PS-LPFG; (c) System output spectrum after PS-LPFG[16]
Fig. 15. (a) Bidirectionally pumped all-fiber oscillator setup; (b) Reflectance spectra of HR-FBG (blue line) and LR-FBG (orange line)[48]
Fig. 16. Schematic diagram of the refractive index change of the fiber when the femtosecond pulsed laser beam is incident from the left[52]


Set citation alerts for the article
Please enter your email address

© Copyright 2018-2021 | Chinese Laser Press. All Rights Reserved 沪ICP备15018463号-20