
Xinqiang Wang, Qiuyu Liang, Song Ye, Fangyuan Wang, Shu Li, Shan Yin, Yongying Gan. Atmospheric Carbon Dioxide Inversion and Surface Reflectance Analysis Based on Ratio Method[J]. Laser & Optoelectronics Progress, 2022, 59(1): 0101001
- Laser & Optoelectronics Progress
- Vol. 59, Issue 1, 0101001 (2022)
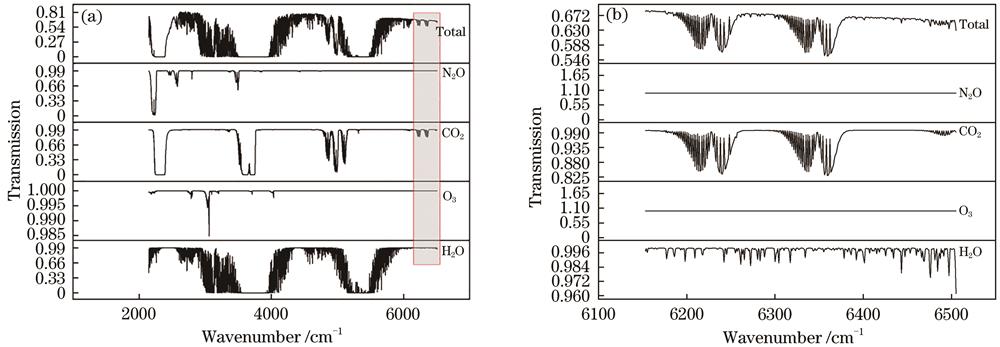
Fig. 1. Transmittance spectra of each gas. (a) Transmittance spectra of CO2, N2O, O3, and H2O; (b) local magnification
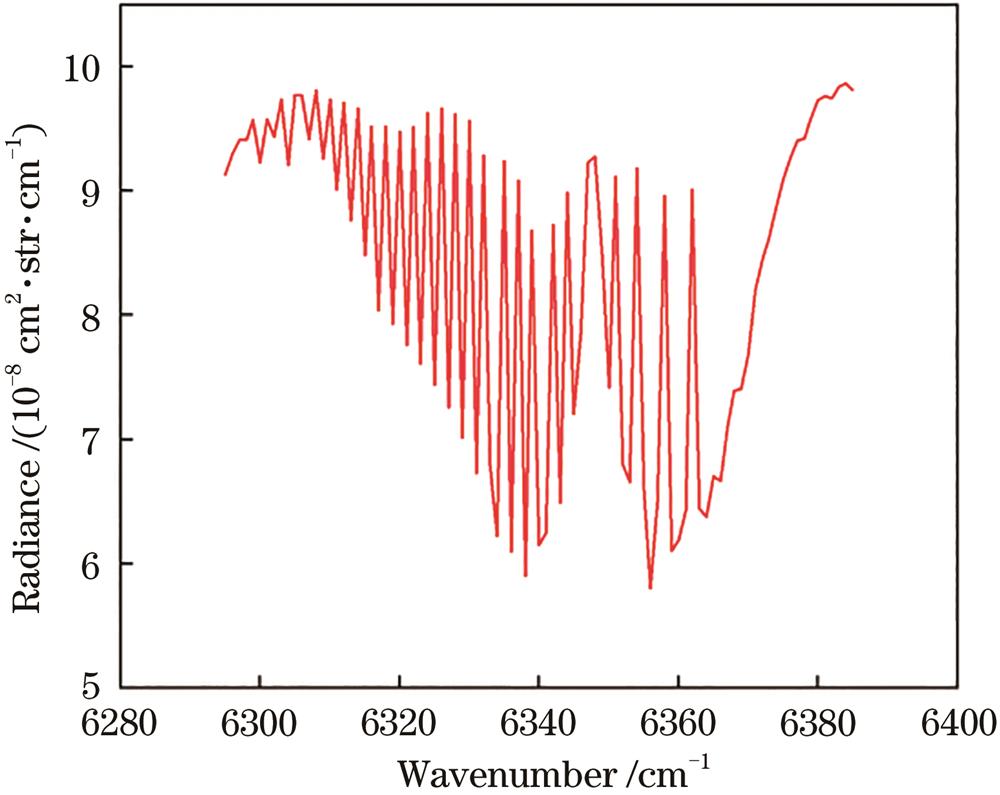
Fig. 2. Simulated radiance spectrum at the absorption zone of 1.58-μm CO2
Fig. 3. Radiance spectra at the absorption zone of 1.58-μm CO2 under different aerosols
Fig. 4. Radiance spectra at the absorption zone of 1.58-μm CO2 corresponding to surface reflectance 0.1-0.9 respectively
Fig. 5. Diagram of ratio method
Fig. 6. Fitting results between spectral radiance ratios and carbon dioxide concentration near 6310 cm-1 absorption peaks at different surface reflectivity. (a) 0.05; (b) 0.16; (c) 0.3; (d) 0.5; (e) 0.8
Fig. 7. Measured transmittance spectra of different CO2 concentrations
Fig. 8. Linear fitting result between transmittance spectral ratio of measured data and carbon dioxide concentration
|
Table 1. Difference ratio of different reflectivity
|
Table 2. Average fitting results of surface reflectivity with different wavenumbers
|
Table 3. Mean fitting results of different atmospheric models and aerosols
|
Table 4. Technical index of space heterodyne spectrometer

Set citation alerts for the article
Please enter your email address
© Copyright 2018-2021 | Chinese Laser Press. All Rights Reserved 沪ICP备15018463号-20