
Degang Chen, Zieguli Ai, Pengbo Yin, Yanuo Lu, Shunping Li. Research on Identification of Wild Mushroom Species Based on Improved Xception Transfer Learning[J]. Laser & Optoelectronics Progress, 2021, 58(8): 0810023
- Laser & Optoelectronics Progress
- Vol. 58, Issue 8, 0810023 (2021)

Fig. 1. Sample data of wild mushroom images. (a) Amanita exitalis; (b) Amanita fuliginea; (c) Amanita neoovoidea; (d) Amanita parvipantherina; (e) Amanita rubrovolvata; (f) Entoloma quadratum; (g) Panaeolus sphinctrinus; (h) Psilocybe coprophila; (i) Gyromitra infula; (j) Lonomidotis frondosa
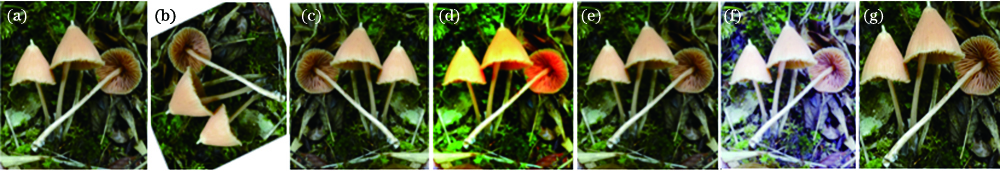
Fig. 2. Effects of different data enhancement methods. (a) Origin image; (b) random rotation; (c) horizontal flip; (d) color dither; (e) Gaussian noise; (f) histogram equalization; (g) random cut
Fig. 3. Structural diagram of Xception
Fig. 4. Experimental flow chart of wild mushroom species identification model
Fig. 5. Principle diagram of CBAM's realization
Fig. 6. Comparison of three kinds of neural network structures. (a) Traditional neural network; (b) Dropout neural network; (c) Disout neural network
Fig. 7. Comparison among model parameters for different training methods. (a) Accuracy; (b) average training time
|
Table 1. Structures of A, B, C, and D components in Xception
|
Table 2. Structures of E, F, and G components in Xception
|
Table 3. Comparison among different feature map disturbance forms
|
Table 4. Comparisonamong different training methods
|
Table 5. Comparison among different proportions
|
Table 6. Comparison among different model experiments

Set citation alerts for the article
Please enter your email address
© Copyright 2018-2021 | Chinese Laser Press. All Rights Reserved 沪ICP备15018463号-20