• Spectroscopy and Spectral Analysis
  • Vol. 42, Issue 3, 933 (2022)
Yu-ru KONG1、*, Li-juan WANG1、1; *;, Hai-kuan FENG2、2;, Yi XU1、1;, Liang LIANG1、1;, Lu XU1、1;, Xiao-dong YANG2、2; *;, and Qing-qi ZHANG1、1;
Author Affiliations
  • 11. School of Geography, Geomatics and Planning, Jiangsu Normal University, Xuzhou 221116, China
  • 22. Key Laboratory of Quantitative Remote Sensing in Agriculture of Ministry of Agriculture, Information Technology Research Center, Beijing Academy of Agriculture and Forestry Sciences, Beijing 100097, China
  • show less
    DOI: 10.3964/j.issn.1000-0593(2022)03-0933-07 Cite this Article
    Yu-ru KONG, Li-juan WANG, Hai-kuan FENG, Yi XU, Liang LIANG, Lu XU, Xiao-dong YANG, Qing-qi ZHANG. Leaf Area Index Estimation Based on UAV Hyperspectral Band Selection[J]. Spectroscopy and Spectral Analysis, 2022, 42(3): 933 Copy Citation Text show less
    Location of the study area and experimental design of winter wheat
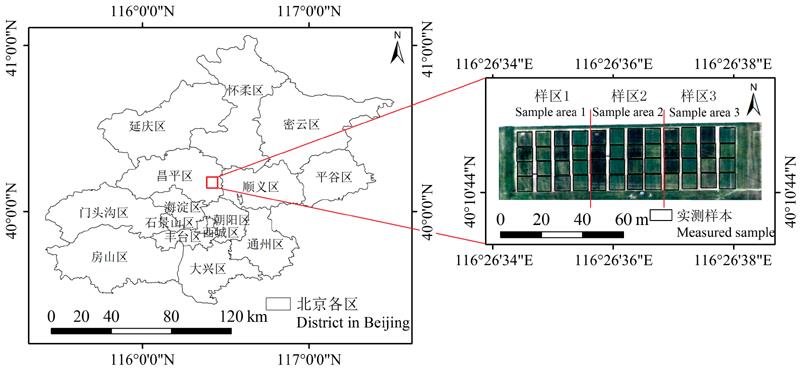
    Fig. 1. Location of the study area and experimental design of winter wheat
    The curve of root mean square error(n=32)
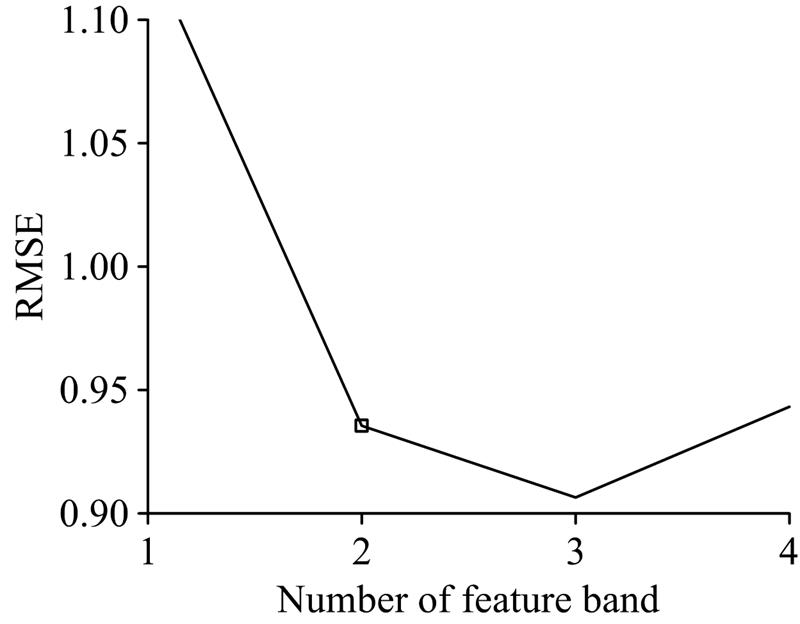
    Fig. 2. The curve of root mean square error(n=32)
    The determination coefficient and root mean square error of vegetation indexes and LAI (n=32)(a): R2 for LAI and NDSI; (b): RMSE for LAI and NDSI; (c): R2 for LAI and RSI; (d): RMSE for LAI and RSI; (e): R2 for LAI and SSI; (f): RMSE for LAI and SSI
    Fig. 3. The determination coefficient and root mean square error of vegetation indexes and LAI (n=32)
    (a): R2 for LAI and NDSI; (b): RMSE for LAI and NDSI; (c): R2 for LAI and RSI; (d): RMSE for LAI and RSI; (e): R2 for LAI and SSI; (f): RMSE for LAI and SSI
    Results of LAI models with different band combinations (n=16)(a): VI_OIF_SVR; (b): VI_OIF_PLSR; (c): VI_OIF_RFR; (d): VI_SPA_SVR; (e): VI_SPA_PLSR; (f): VI_SPA_RFR; (g): VI_E_SVR; (h): VI_E_PLSR; (i): VI_E_RFR; (j): VI_F_SVR; (k): VI_F_PLSR; (l): VI_F_RFR
    Fig. 4. Results of LAI models with different band combinations (n=16)
    (a): VI_OIF_SVR; (b): VI_OIF_PLSR; (c): VI_OIF_RFR; (d): VI_SPA_SVR; (e): VI_SPA_PLSR; (f): VI_SPA_RFR; (g): VI_E_SVR; (h): VI_E_PLSR; (i): VI_E_RFR; (j): VI_F_SVR; (k): VI_F_PLSR; (l): VI_F_RFR
    Spatial distribution map of LAI in winter wheat
    Fig. 5. Spatial distribution map of LAI in winter wheat
    植被指数计算公式
    归一化差异光谱指数(NDSI)[9]NDSI(i, j)=(Ri-Rj)/(Ri+Rj)
    新型双波段指数比值光谱指数(RSI)[9]RSI(i, j)=Ri/Rj
    简单光谱指数(SSI)[10]SSI(i, j)=Ri-Rj
    归一化差异植被指数(NDVI)[11]NDVI=(R800-R670)/(R800+R670)
    常规双波段指数比值植被指数(RVI)[12]RVI=R800/R670
    差值植被指数(DVI)[13]DVI=R800-R670
    Table 1. Vegetation indexes and formulas
    排序波段组合最佳指数标准差相关系数
    1R466-R750855 249342.099 60.000 4
    2R638-R734258 907310.688 90.001 2
    3R538-R754231 899394.227 90.001 7
    4R542-R754110 238396.857 10.003 6
    5R510-R742109 380317.201 40.002 9
    Table 2. Optimal indexes of band combination (n=32)
    植被指数相关系数
    NDSI_OIF0.653**
    RSI_OIF0.677**
    SSI_OIF0.405*
    NDSI_SPA0.711**
    RSI_SPA0.712**
    SSI_SPA0.652**
    NDSI_E0.728**
    RSI_E0.728**
    SSI_E0.722**
    NDVI0.659**
    RVI0.683**
    DVI0.518**
    Table 3. Correlation between cotton LAI values and vegetation indexes (n=32)
    Yu-ru KONG, Li-juan WANG, Hai-kuan FENG, Yi XU, Liang LIANG, Lu XU, Xiao-dong YANG, Qing-qi ZHANG. Leaf Area Index Estimation Based on UAV Hyperspectral Band Selection[J]. Spectroscopy and Spectral Analysis, 2022, 42(3): 933
    Download Citation