
Qiuhan Jin, Yangping Wang, Jingyu Yang. Remote Sensing Image Change Detection Based on Density Attraction and Multi-Scale and Multi-Feature Fusion[J]. Laser & Optoelectronics Progress, 2019, 56(12): 121003
- Laser & Optoelectronics Progress
- Vol. 56, Issue 12, 121003 (2019)
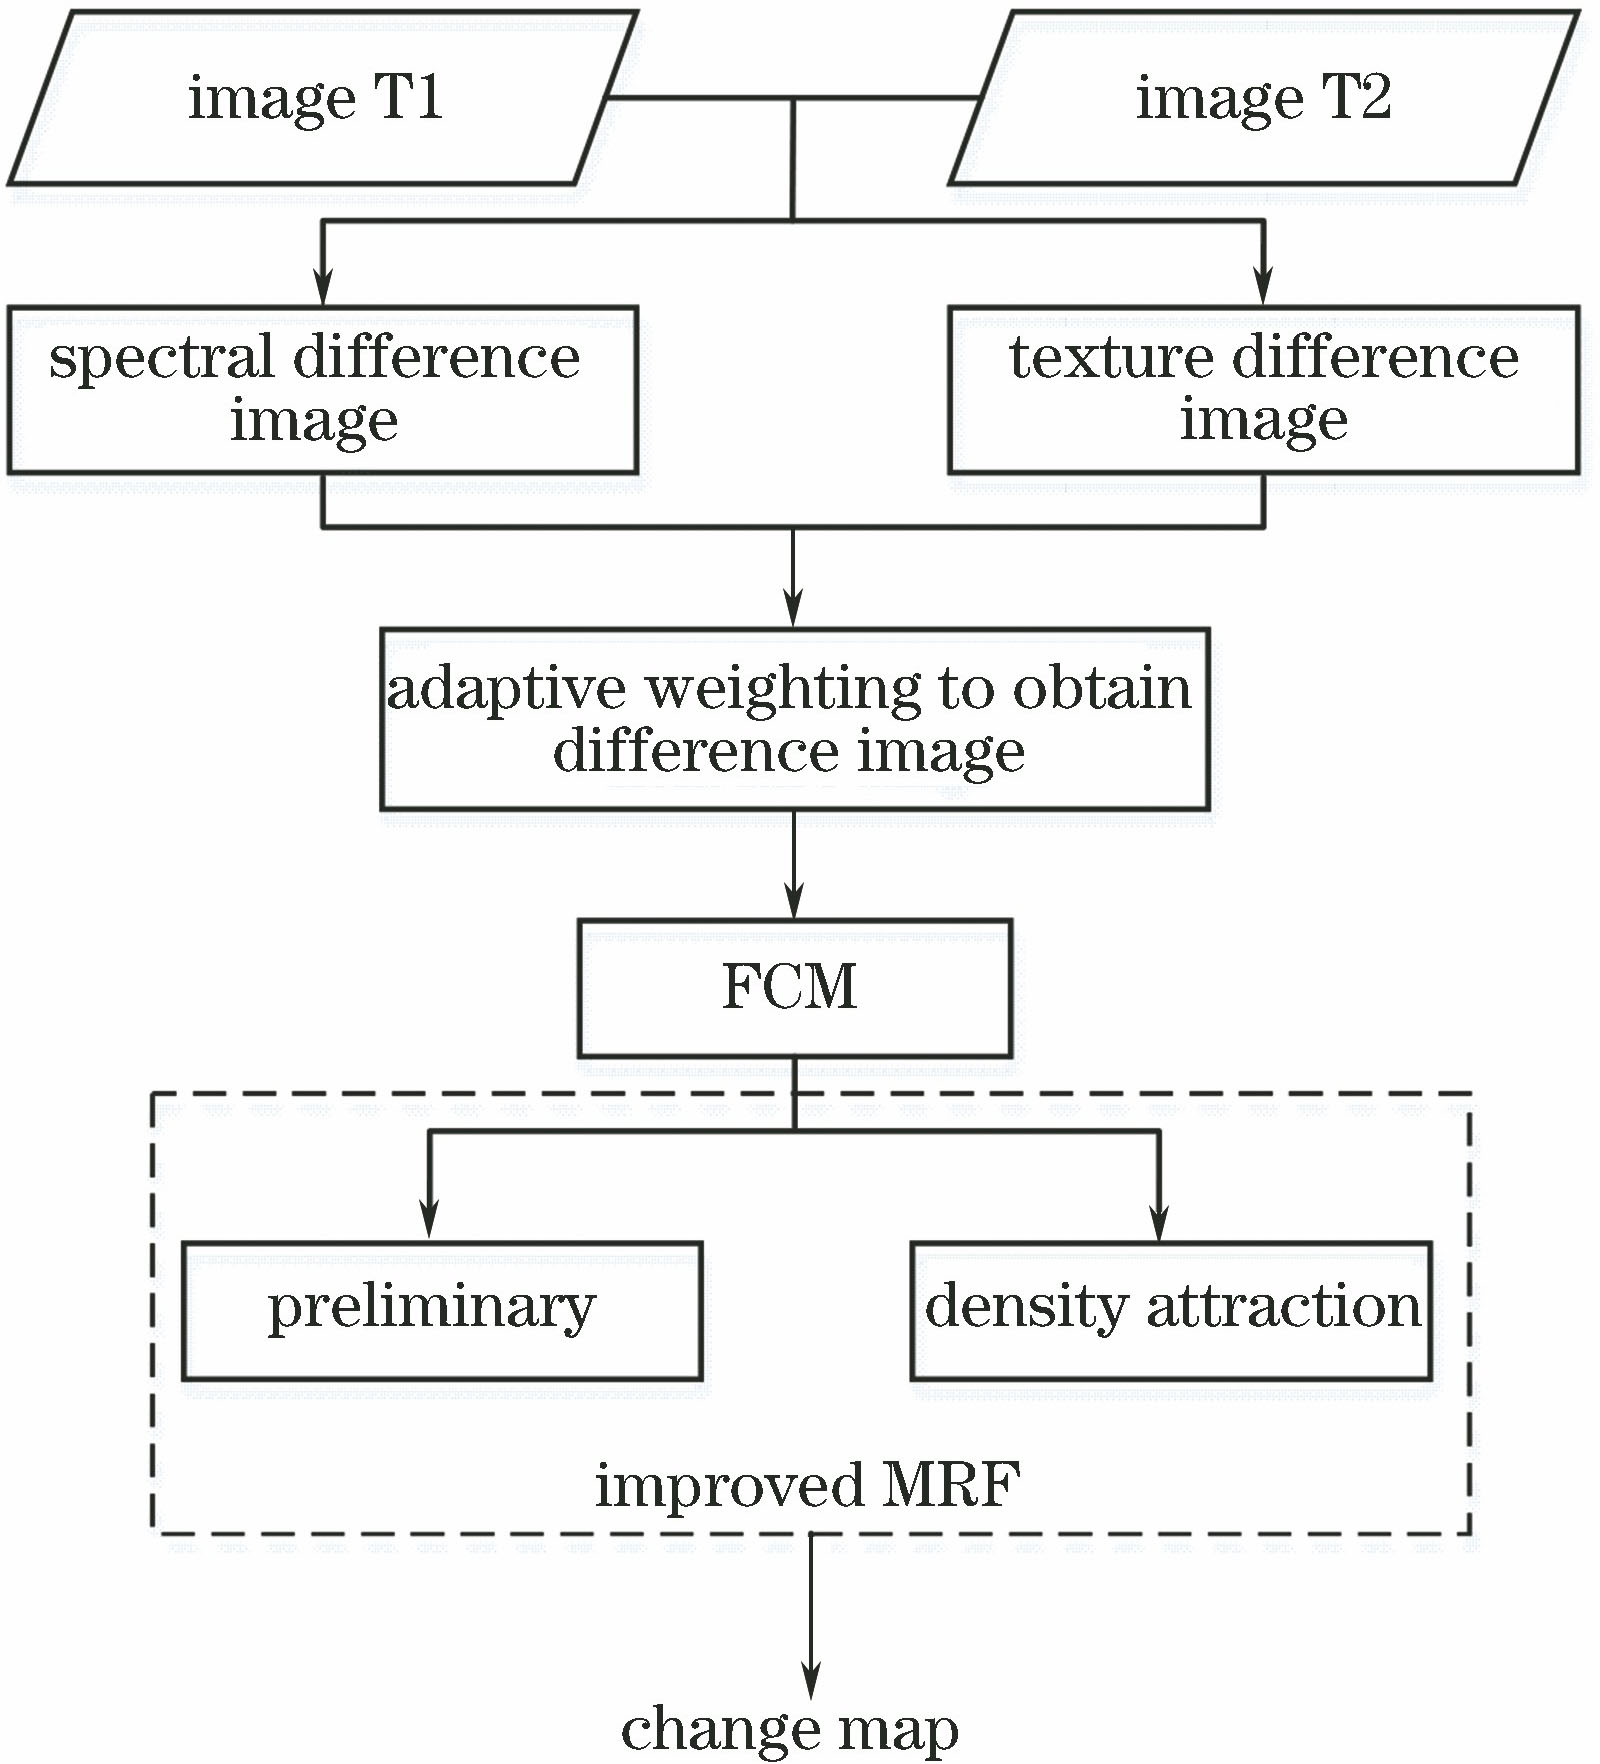
Fig. 1. Flow chart of proposed algorithm
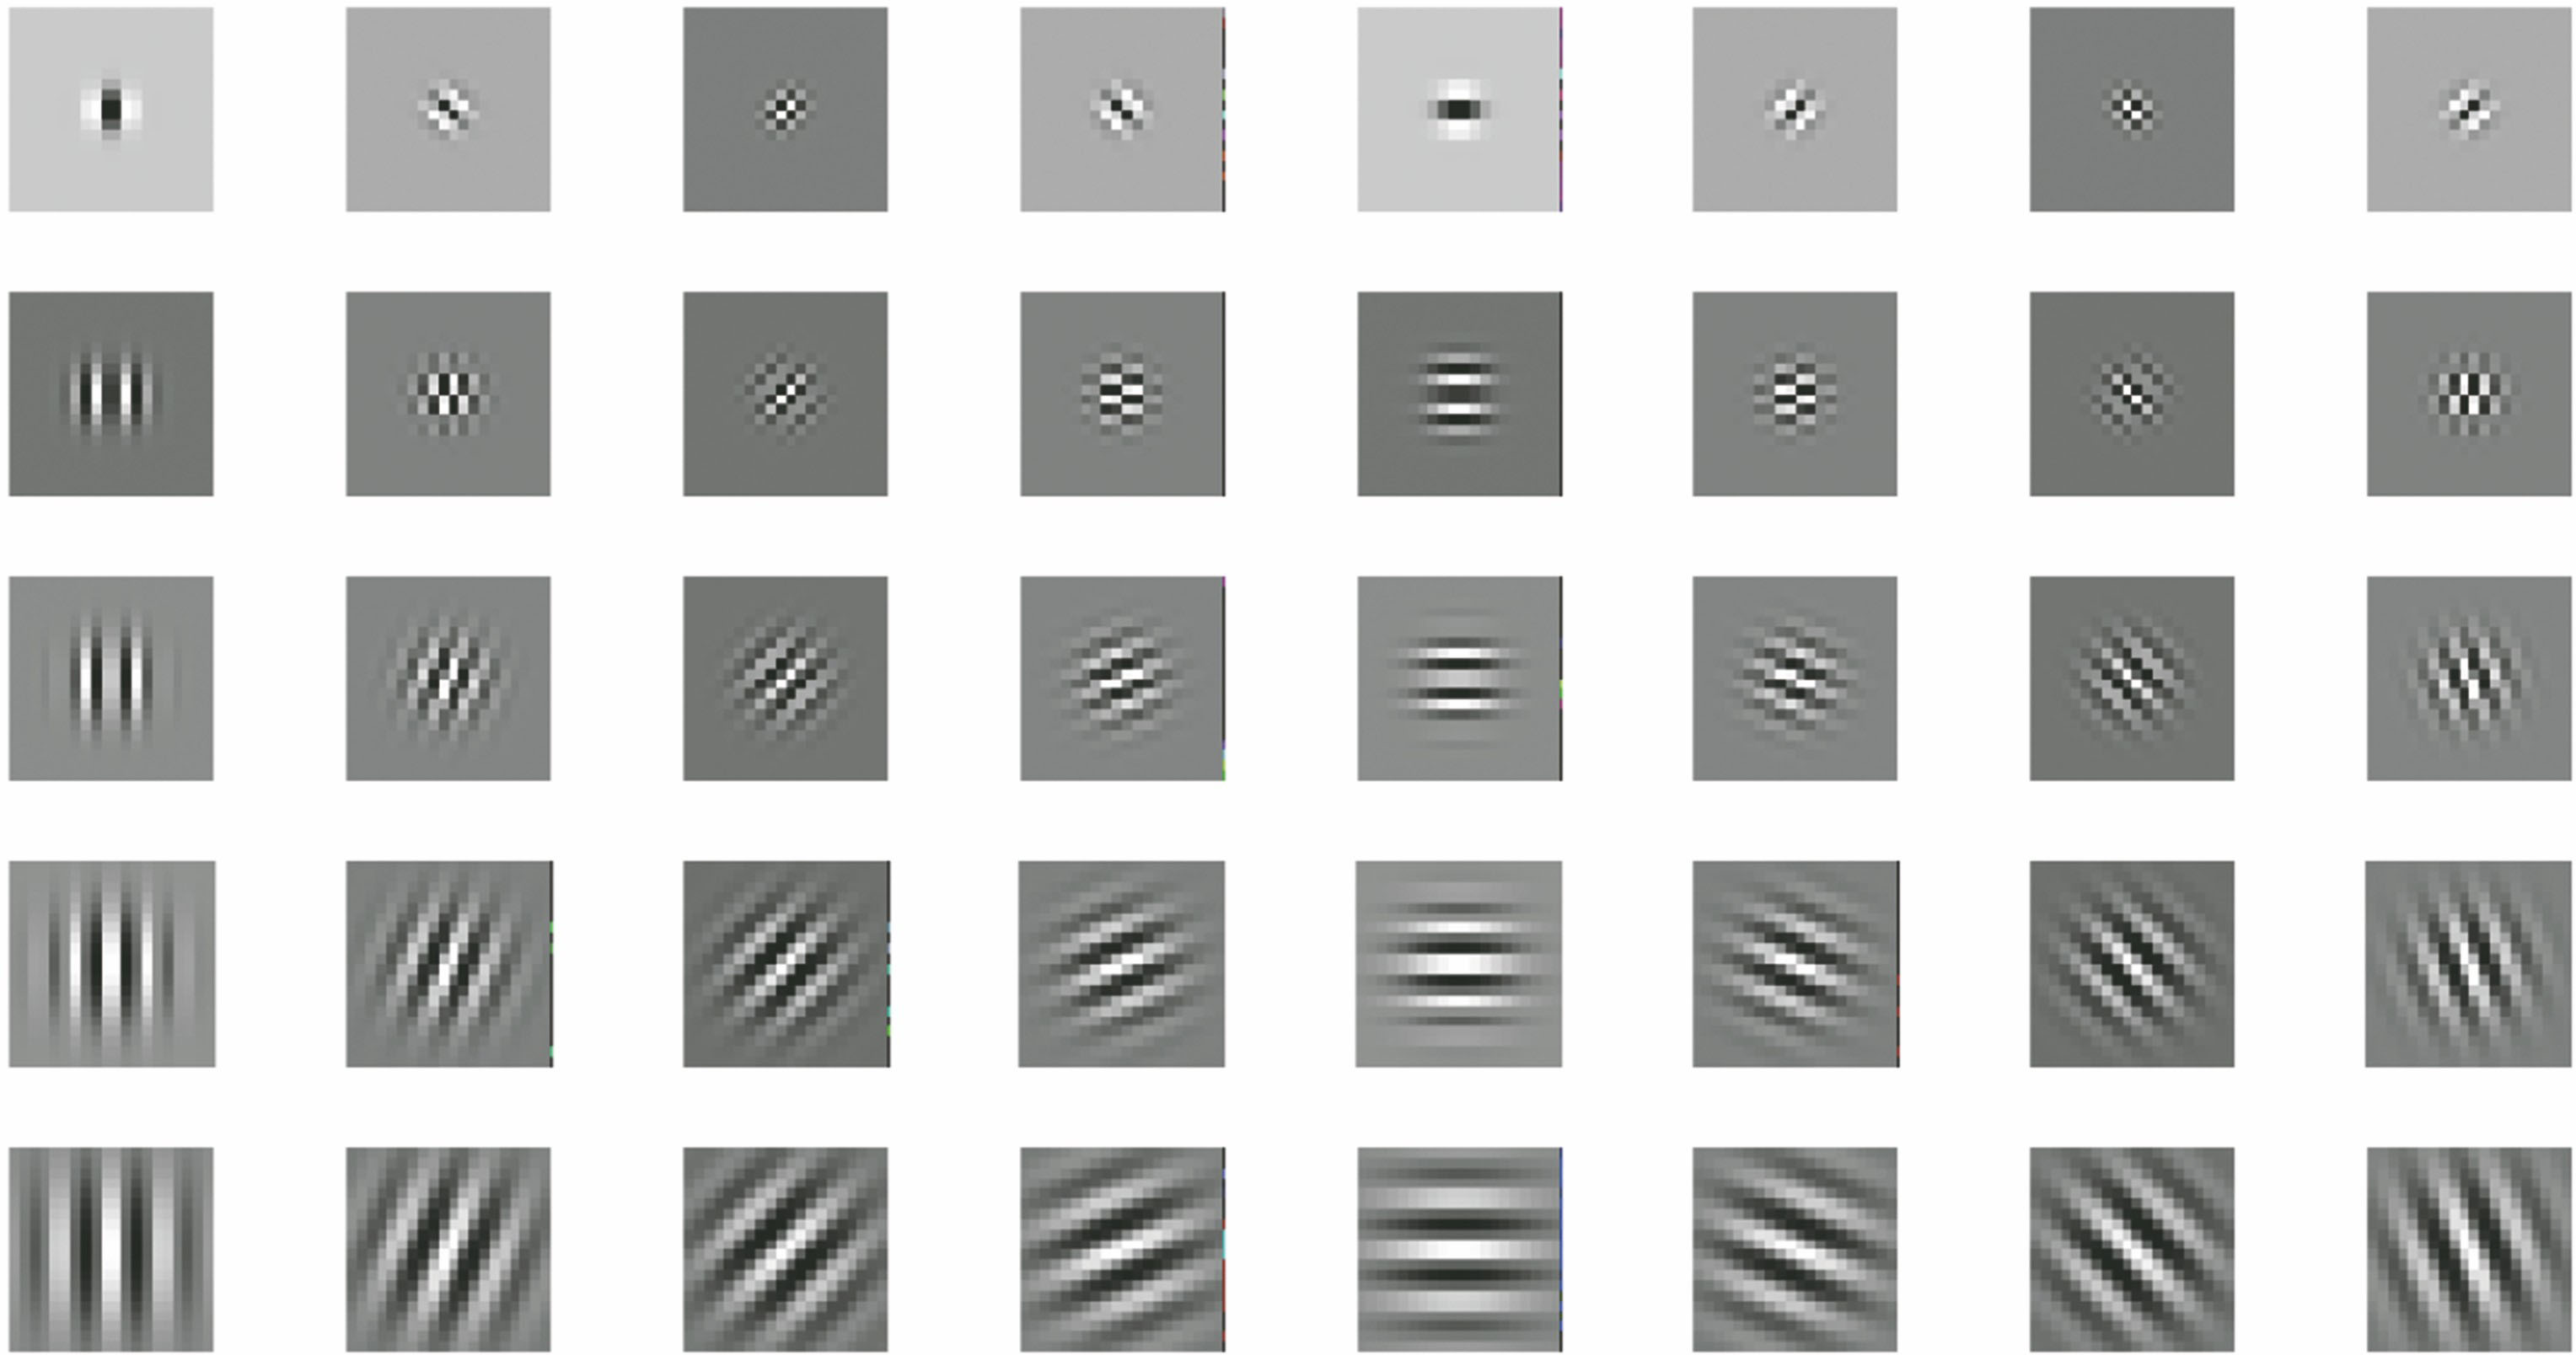
Fig. 2. Schematic of Gabor filter
Fig. 3. Schematic of neighborhood system and distance. (a) Neighborhood system centered at (i, j); (b) distance between center pixel (i, j) and its neighborhood
Fig. 4. Remote sensing image data and reference change map in first set of experiments. (a) 2014; (b) 2018; (c) reference change map
Fig. 5. Remote sensing image data and reference change map for second set of experiments. (a) 2016; (b) 2018; (c) reference change map
Fig. 6. Results of change detection under different weights and classification methods for first set of experiments. (a) WS=0, WT=1, MRF; (b) WS=0.4, WT=0.6, MRF; (c) WS=0.6, WT=0.4, MRF; (d) WS=1, WT=0, MRF; (e) adaptive weight, MRF; (f) adaptive weight, DAMRF
Fig. 7. Results of change detection under different weights and classification methods for second set of experiments. (a) WS=0, WT=1, MRF; (b) WS=0.4, WT=0.6, MRF; (c) WS=0.6, WT=0.4, MRF; (d) WS=1, WT=0, MRF; (e) adaptive weight, MRF; (f) adaptive weight, DAMRF
Fig. 8. Continuous graph of detection accuracy for first set of experiments
Fig. 9. Continuous graph of detection accuracy for second set of experiments
|
Table 1. Quantitative evaluation of change detection results for Fig. 6
|
Table 2. Quantitative evaluation of change detection results for Fig. 7

Set citation alerts for the article
Please enter your email address
© Copyright 2018-2021 | Chinese Laser Press. All Rights Reserved 沪ICP备15018463号-20