
Li-hong HU, Jin-tong ZHANG, Li-yun WANG, Gang ZHOU, Jiang-yong WANG, Cong-kang XU. Optimization of Working Parameters of Glow Discharge Optical Emission Spectrometry of High Barrier Aluminum Plastic Film[J]. Spectroscopy and Spectral Analysis, 2022, 42(3): 954
- Spectroscopy and Spectral Analysis
- Vol. 42, Issue 3, 954 (2022)
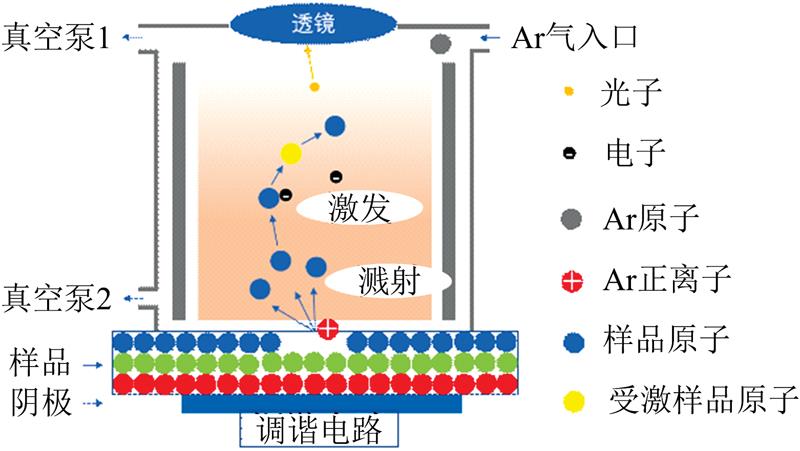
Fig. 1. The principle of Pulsed-RF-GDOES
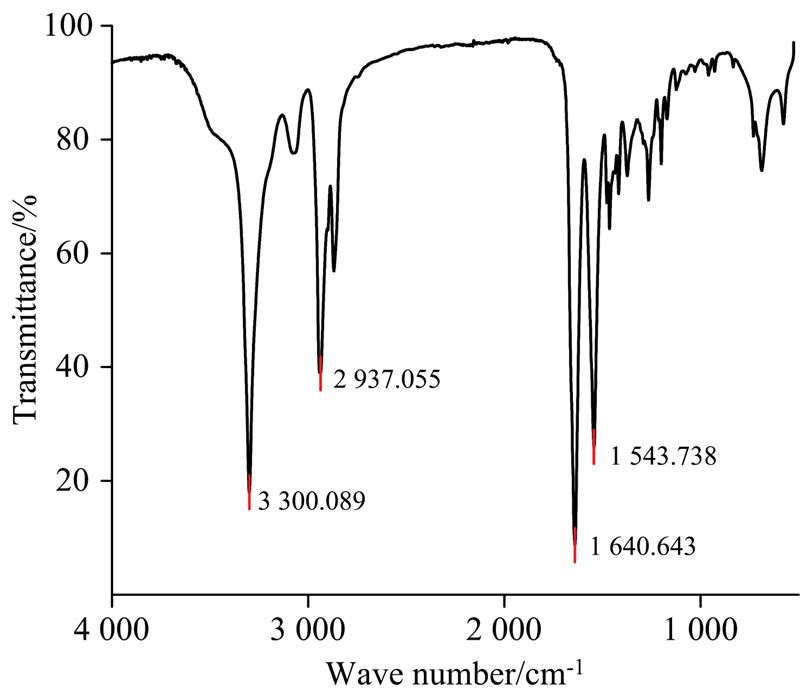
Fig. 2. FTIR spectrum of the sample
Fig. 3. GDOES sputtering depth profiles of samples under the same working pressure (750 Pa), power (20 W), pulsed frequency (3 000 Hz), duty cycle (0.187 5) and different sputtering gases and powers
(a): Ar gas; (b): Ar-O2
(a): Ar gas; (b): Ar-O2
Fig. 4. Layered structure of aluminum-plastic film
Fig. 5. Craters of the sample after GDOES depth profiling
Fig. 6. (a)—(e) GDOES sputtering depth profiles of samples under the same working pressure (750 Pa), pulsed frequency (3 000 Hz), duty cycle (0.187 5) and different powers((a)20 W, (b)25 W, (c)30 W, (d)35 W, (e)40 W); (f) Measured and normalized Al intensity of (a)—(e) GDOES depth profiles
Fig. 7. Relationship between sputtering time and sputtering power
Fig. 8. Definition of depth resolution
Fig. 9. Depth resolution of 16%~84% normalized Al intensity with different sputtering powers
Fig. 10. Measured GDOES Al depth profile under working pressure of 750 Pa and power of 20 W
Fig. 11. Measured and normalized Al intensity of GDOES depth profiles with different working pressures
Fig. 12. Relationship between sputtering time and pressure
Fig. 13. Depth resolution of 16%~84% normalized Al intensity with different pressures
Fig. 14. Definition of signal to noise ratio
Fig. 15. Measured and normalized Al intensity of GDOES depth profiles with sputtering gases Argon and mixtures of Argon and Oxygen
|
Table 1. Depth resolution for different powers
|
Table 2. Signal to noise ratio for different powers
|
Table 3. Depth resolution for different pressure
|
Table 4. Signal to noise ratio of different pressure
|
Table 5. Signal to noise ratio and Depth resolution of different gas

Set citation alerts for the article
Please enter your email address
© Copyright 2018-2021 | Chinese Laser Press. All Rights Reserved 沪ICP备15018463号-20