
Arutyun Bagramyan, Loïc Tabourin, Ali Rastqar, Narges Karimi, Frédéric Bretzner, Tigran Galstian. Focus-tunable microscope for imaging small neuronal processes in freely moving animals[J]. Photonics Research, 2021, 9(7): 1300
- Photonics Research
- Vol. 9, Issue 7, 1300 (2021)
Abstract
1. INTRODUCTION
Over the last decade, the development of miniaturized microscopes has been instrumental in studying neural circuits of deep brain regions in freely behaving animals [1–4]. Although it is well established that neurons do not function as simple point processes, less is known about dendritic and synaptic integration in neural circuit function. Indeed, we have a rather good knowledge of how neuronal assemblies contribute to specific behaviors; nevertheless, little is known about the spatiotemporal dynamics of dendrites and dendritic spines, wherein the information is integrated and processed. Therefore, imaging small neuronal processes in freely behaving animals using genetically encoded calcium indicators or voltage-sensitive dyes [5–7] appears to be the next step toward the understanding of brain functions in normal and neuropathological conditions.
Benchtop two-photon microscopy has been the first approach to record calcium transients from spines, dendrites, and fine processes in the brains of head-restrained animals [8–10]. Although promising, head-restrained models cannot address normal behaviors such as grooming, locomotor gaits, spatial navigation, or social interactions that require free movements. Furthermore, head fixation causes aberrant sensory feedback on the neck and the head, leading to stress, fatigue, and consequently abnormal neuronal processing conditions that are no longer representative of normal functioning [11–15].
To overcome this limitation, portable miniaturized high-resolution devices have been developed [16–23]. Among these, a variety of fiber-scanning techniques have demonstrated the capacity to record different small neuronal structures [16–20]. However, these systems have multiple drawbacks regarding their size, weight, complexity of movement correction algorithms, and the sampling rate [ (fps)] that limit experiments primarily to structural imaging [24]. Recently, a miniaturized two-photon system reported the use of microelectromechanical systems that has enabled a higher acquisition rate ( for ) for imaging of small dendritic trees and spines [22]. Although suitable for functional studies, this system is complex to build and requires the use of hardly accessible, dispersion-adapted optical fibers [22]. Miniaturized systems with external microelectromechanical systems are less complex [16,23], but still require thick fiber bundles that significantly decrease the optical resolution and degrade the quality of images. Finally, miniaturized multiphoton systems use lasers that are bulky, expensive, and barely compatible with the development of future wireless devices. The use of large-diameter optical probes () here is also problematic, because it requires tissue ablation above the region of interest prior to the implantation of probes in the brain. This can damage the brain, alter neuronal activity, and require multiple control experiments [25].
Sign up for Photonics Research TOC. Get the latest issue of Photonics Research delivered right to you!Sign up now
Consequently, there is a lack of minimally invasive, accessible, and miniaturized systems adapted for the functional imaging of fine neuronal processes at different depths in the brain of freely behaving animals. To address these issues, we have developed a novel system using a tunable liquid crystal lens (TLCL, Fig. 1) that enables electrical shift of the imaging plane within a homemade miniaturized single-photon system. Our system is lightweight (), has a high spatiotemporal resolution () and an electrical depth scanning capacity of that exceeds existing systems [26–28], and allows us to image dynamics of small neuronal processes in the cortex of freely moving mice over a wide range of behaviors. We think that this approach could enable the development of new tools to investigate the dynamics of dendrites and dendritic spines, thus broadening our understanding of synaptic integration and processing in physiological and pathological conditions in freely behaving animals.
2. RESULTS
A. Key Features of the Developed Device
To overcome the existing depth scanning limitation and to build the most efficient miniaturized system possible, different optical, mechanical, and electrical criteria were considered. The single-photon approach was preferred over the two-photon one to design the most accessible and wireless-friendly system possible. We used a CMOS sensor with a high sampling rate of 30–50 fps to enable functional imaging of dynamics within neurons and their processes. To image and to record small neuronal structures, we built a high-magnification system, as shown in Fig. 2, that was inspired from a recently reported miniaturized single-photon microscope [29]. The resulting pixel/object ratio of allowed us to distinguish small dendrites, with an average size spines [30] in a field of view. To further facilitate the imaging of small structures, we built a special gradient index (GRIN) probe assembly, shown in Fig. 2(e), with low optical aberrations compared to those of conventional singlet probes [31,32]. To image neuronal activity in three dimensions, we developed and integrated a TLCL that allowed motionless electrical scanning through a depth. To diminish tissue damage, our tunable device was optically coupled to a minimally invasive, small-diameter (0.5 mm) GRIN probe assembly. Finally, our epifluorescence configuration allowed us to image and record calcium activity from fluorescent proteins and calcium indicators, such as GCaMPs.
B. Design of the Tunable Liquid Crystal Lens
Three mechanisms enable depth scanning: stepper motor mechanical movement, mechanical deformation (e.g., bending the interface between two liquids), and motionless changes of the focal distance of the lens by changing the refractive index of the lens material [33]. Mechanical movement is well known, but the components are bulky, heavy, and fragile [34]. Interface bending requires high voltage, provides less focus tuning, and is limited in the choice of aperture for the lens. Indeed, the smallest commercially available electrowetting lens that we found has a diameter of 1.6 mm (A-16F, Corning, NY, USA). By comparison, motion-free focusing by changing the refractive index of a liquid crystal lens has none of these limitations. Electrically variable focusing with a liquid crystal lens is achieved by taking advantage of the following properties of the liquid crystal lens: light will propagate with different phase delays depending upon the angle between its incident wave vector and the average molecular orientation (the optical axis) of the liquid crystal, often represented by a unit vector [Fig. 6(a) in Appendix A] [35].
Most importantly, one can easily reorient the optical axis by applying a very small electric field. Hence, liquid crystal molecules can be aligned in a nonuniform way [Fig. 6(c)] to generate a spherical delay in the phase of transmitted light, which is the key to electrically variable focusing [36,37]. Gradual recovery of uniform alignment of the liquid crystal molecules [Fig. 6(b)] can be used to adjust the focusing effect.
Liquid crystal optical devices have numerous advantages, which include low electrical power consumption, high optical power, low weight, and small size [33]. Although this technology has been successfully introduced in a variety of consumer electronic products (e.g., DVD readers, webcams, and mobile phones), its integration in neuroscience imaging applications has been limited to the macroscopic system [38]. We have designed and built [Fig. 1(a)] a small (), lightweight (), low power consumption () TLCL that is perfectly suited for miniaturized neuroimaging systems [27]. Moreover, the small 0.5 mm clear aperture of our TLCL enables direct coupling with small diameter optical probes [Fig. 2(e)] and the high ( diopters) optical power of our lens provides much higher depth-scanning ability () compared to current commercial devices (A-16F, Corning, NY, USA). The focal distance of the TLCL can be controlled using the voltage (Fig. 7 in Appendix A) or/and the frequency [Fig. 1(b)] of the electrical excitation [37].
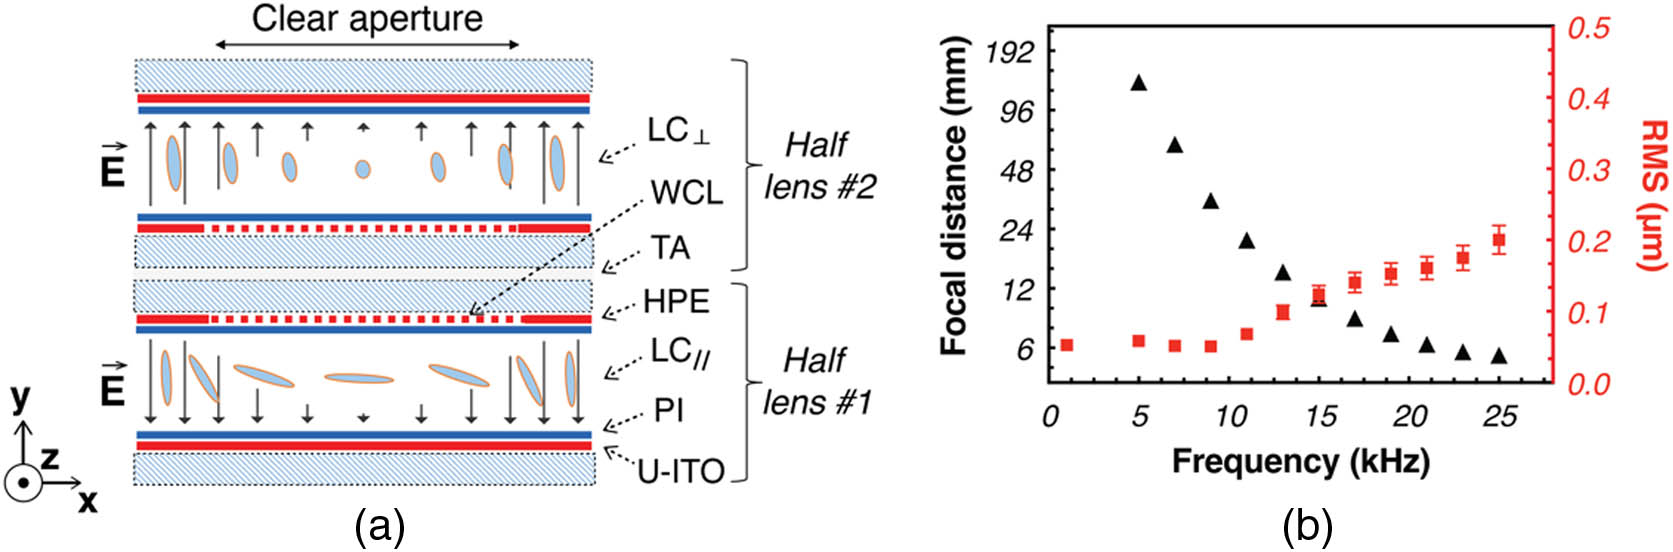
Figure 1.Liquid crystal lens schematics and characterization. (a) Schematic demonstration of the structure of the TLCL used (see the main text for details). WCL, weakly conductive layer; PI, polyimide alignment layer; HPE, hole patterned electrode; TA, transparent adhesive; and U-ITO, uniform ITO electrode. The distribution of the electrical field is shown by the black arrows within the LC layer. (b) Control of the focal distance of the TLCL by the frequency of the excitation electrical signal (AC square shaped, at
![]()
Figure 2.Schematic presentation of the ensemble of the imaging system. (a) Schematic of the system: 1, extension cable for the CMOS; 2, TLCL wires; 3, optical fiber; 4, light source; 5,
C. Optical Probe
Our lens assembly was well suited for imaging deep brain regions. The probe consisted of the three optical elements presented in Fig. 2(e). First, we used a 45° prism with a sharp tip end that facilitated the insertion of the optical probe into the brain. The prism also allowed us to image from the side rather from the front (standard flat tip) where the tissue tends to compress due to the insertion of the probe. Second, we choose a high numerical aperture imaging GRIN to maximize fluorescence collection [Fig. 2(e)]. Finally, to transmit the collected light to the rest of the optical system we used a GRIN rod lens with low optical aberrations [31].
D. System Schematic
To drive the TLCL, two fine wires [Fig. 2(a), 2] were conducted from the micro-endoscope to the custom-made rotary joint system [Fig. 2(a), 6] that prevented twisting of the cable and allowed preservation of the natural movement of the animal [Figs. 2(f)–2(h)]. To generate an AC signal in the working frequency range (1–30 kHz), a data acquisition system [Fig. 2(a), 8] with a high sampling rate (up to 900 kS/s) was chosen. Finally, LabVIEW software (NI, Austin, TX, USA) was used for dynamic control of the TLCL and triggering of 4, 5, 9 [Fig. 2(a)] for time-lapse imaging over long periods of time.
E. Optical Characterization of the Assembly
Before assembling the micro-endoscope, we characterized the optical performance of the TLCL. A low-voltage, square-shaped AC signal was used to change the focal distance [Fig. 1(b)]. The TLCL achieved a minimal focal distance of 5.6 mm while maintaining a very low, 0.2 μm RMS, aberrations [Fig. 1(b)].
Prior to assembling, the experimentally obtained optical performances of the TLCL were used in Zemax optical studio software (Zemax, LLC, Kirkland, WA, USA) to simulate the focal adjustment capability [Fig. 2(c)] of the final device. The experimental focal shift of the assembly was measured using fluorescence microspheres (diameter ) mounted with a thin () cover glass that provided the ability to scan through the entire working distance of the probe (). The experimental results agreed with the theoretical predictions [Fig. 2(c)]. We then characterized the changes in optical resolution during the electrical shift of the working distance of the final assembly [Fig. 2(d)] by measuring the point spread function of fluorescent microspheres. The results in Fig. 3(a) show a slight decrease in resolution due to an increase in optical aberrations [Fig. 1(b)] and light scattering by the TLCL. Average values of lateral and axial resolutions were, respectively, and . Intensity profiles in Fig. 3(e) show that neurons could be clearly identified through the entire range of depth shift with the TLCL.
![]()
Figure 3.Electrical focal shift and characterization of optical parameters of the mDS1s. (a) Resolution and (b) magnification during electrical focal shift. Error bars correspond to standard deviations. (c) Scale bar samples imaged at different depths using the TLCL. Spacing between the lines is 10 μm. (d)
Having confirmed that our device is suitable for adaptive focusing, we then imaged different brain structures in vitro. As demonstrated in Fig. 3(f), the electrical scan, made with the TLCL, allowed us to image through different layers of fixed tissue preparations. The blurry sections within the first (shift = 0 μm) and last (shift = 90 μm) images were brought back into focus (shift = 30 μm and 60 μm) to clearly show the presence of various dendritic structures [Fig. 3(f)].
F. Imaging of Dendrites and Spine Activity in Animals
We designed our miniaturized single-photon device to image fine neuronal processes that are fundamental to brain functioning. Using our system, we performed time-lapse imaging of calcium transients in small neuronal processes of freely moving mice. TLCL was used to adjust the position of the focal plane at the optimal imaging depth where multiple fine neuronal processes were in focus. We then recorded calcium activity (
![]()
Figure 4.Time-lapse imaging of
We then proceeded to the demonstration of the ability of our system to correlate the calcium dynamics of various neuronal structures to the behavioral activity of the animal [Fig. 4(f)]. As shown in Figs. 4(f) and 4(h), the level of calcium activity within the entire field of view was constant and equal to the baseline in the animal at rest [Fig. 4(h)]. However, the level of calcium activity was modulated in different neurons and their respective fine processes according to the motor activity while the animal was walking or grooming [Fig. 4(g)].
Having confirmed that our system can be used to image and characterize the activity of fine neural processes during different behavioral tasks, we proceeded to the demonstration of the critical advantages enabled by the electrical depth scanning (Fig. 5). As shown in Fig. 5(a), electrical adjustment (55 μm) of the depth position revealed new neuronal features, undetectable at the original working distance of the probe [Fig. 5(a), top]. For instance, within ROI #1, we have discovered a fine dendritic branch [red arrows, Figs. 5(a) and 5(b)] that was connected to the pair of newly revealed neurons (orange arrows). A continuation of neuronal prolongation within ROI #2 was also identified [Fig. 5(c)] and quantified [Fig. 5(d)]. Thus, the electrical depth shift allowed a better visualization of the neuronal network by enabling the detection of new structures and connections.
![]()
Figure 5.Electrical focus adjustment and time-lapse imaging of
Finally, we have also demonstrated the capacity of our system to electrically focus on even smaller neuronal processes, such as dendritic spines, while examining rhythmic head movements [Fig. 5(j)]. The images obtained at the original working distance of the GRIN probe contained only blurry neuronal structures [Fig. 5(e)]; electrical adjustment of the working distance () made it possible to clearly identify the soma, dendritic processes, and spines [Fig. 5(f)]. Furthermore, time-lapse imaging [Fig. 5(h)] showed the capacity of our system to differentiate dynamics of a single dendritic spine from its parental dendritic branch and the soma [Fig. 5(g)], which were highly correlated with head movements [Figs. 5(j) and 5(i)] of the animal.
3. DISCUSSION AND CONCLUSION
In this study, we have presented a miniature depth scanning single-photon system (mDS1s) that allows multiplane imaging of neurons and their fine processes, including dendrites and dendritic spines, in freely moving animals. Three fundamental limitations have been successfully addressed.
First, we developed and incorporated a TLCL that enabled electrical modulation of the imaging plane within our mDS1s. The utility of this feature was shown by imaging neurons [Fig. 3(e)] and fine neuronal processes (Fig. 5) that were undetectable in unfocused positions (Fig. 5). Electrical modulation also improved the efficiency of surgical procedures by drastically reducing the rate of animal sacrifice due to an incorrect installation depth of the probe. Compared to the commonly used electrowetting lenses [16,23,39,40], our TLCL has a nine-times higher optical power (180 diopters) that enables direct optical coupling with small-diameter GRIN probe assemblies [Fig. 2(d)]. Another advantage is the small size (thickness can be below 0.5 mm; the ratio of diameter to the external diameter can be ) and weight () of LC lens that allows a compact optical design (Fig. 2) and adaptive imaging with constant magnification [Fig. 3(b)] during the entire tunability range. The TLCL also has low power consumption thanks to the lower operational voltages ( versus 60 V for the electrowetting lens) and is, therefore, better suited for integration within future wireless devices.
Second, our device shows a high spatial resolution within a single-photon system that can image fine neuronal processes. To achieve this result, we have designed our device with high magnification along with low optical aberrations. Using our mDS1s, we have been able to image, record, and correlate the activity of fine neuronal features (e.g., dendrites and dendritic spines) with different behaviors of freely behaving animals. We think that our in vivo results will broaden the experimental repertoire of miniaturized single-photon systems that had been limited to imaging of large neuronal structures (e.g., soma) [26–28,41]. We believe the motionless scanning approach of our mDS1s will significantly contribute to the efficient detection and imaging of fine neuronal structures that are particularly hard to detect in the absence of perfect focus.
Third, the developed mDS1s also remedies the size and weight limitations of existing depth-scanning devices [16,22,23] that can affect an animal’s head movement, navigation, and multiple decision-making choices. To improve the animal’s condition and to preserve its natural behavior, we developed one of the lightest () and smallest () mDS1s reported so far. The compact optical design [Fig. 2(d)] and the choice of mechanical frame materials were the key parameters that led to this result. We think that our mDS1s will provide benefits for the animals and improve the quality of behavioral data in many investigations (e.g., memory and cognition) based on the natural movement (head and body) of animals.
To summarize, we assert that the advantageous mechanical and optical characteristics of our mDS1s can enable new investigations of fine neuronal structures in physically limited subjects (e.g., younger, older, injured) that cannot carry currently available heavier devices. Among these subjects are smaller (younger) subjects that are usually used to study neurogenesis and the formation of new dendritic branches and spines of adult-born neurons [42]. Older mice that are physically weaker can also benefit from our lightweight device, as one could study the changes in spine density occurring during normal aging [43] and neurodegenerative pathologies [44,45]. Finally, our mDS1s might allow us to assess functional and structural changes in animal models of neuro traumatic injury, such as spinal cord injury [46] or stroke.
In the near future, the development of two-color, optogenetics-synchronized, and wireless versions of our mDS1s should be considered. We believe the low-voltage and power requirements of the TLCL will significantly facilitate the engineering of such devices.
Acknowledgment
Acknowledgment. We would like to thank LensVector Inc. (San Jose, CA, USA) for its material and financial support of this work. We are grateful to Dr. M. Andrews and Dr. M. Lemieux for their scientific advices. Authors A. Bagramyan and L. Tabourin were supported by FRQNT and NSERC fellowships. T. Galstian is supported by the Canada Research Chair in Liquid Crystals and Behavioral Biophotonics. F. Bretzner is supported by a FRQS scholarship. The research was supported by FRQNT and NSERC grants to T. Galstian and a NSERC grant to F. Bretzner.
A. Bagramyan conceived, designed, built, and characterized the system under the supervision of T. Galstian; A. Bagramyan, L. Tabourin, A. Rastqar, and N. Karimi performed surgery, experiments, calcium imaging, and kinematic analysis under the supervision of F. Bretzner; A. Bagramyan analyzed the data; and A. Bagramyan, T. Galstian, and F. Bretzner wrote the paper. All authors participated in discussion and data interpretation. T. Galstian and F. Bretzner are co-seniors.
APPENDIX A
Figure?
![]()
Figure 6.Schematic demonstration of motionless focusing by reorientation of liquid crystal molecules (filled ellipses). (a) Different phase delays for different angles between the light wavevector
![]()
Figure 7.Characterization of the TLCL. (a) Optical power and (b) aberrations increase proportionally to the driven frequency of the AC square signal applied to the TLCL. The amplitude of the voltage varied from 2.4 V to 4.4 V. (c) RMS aberrations at the maximal optical power, for each optical power and driven voltage. The optimal voltage is 3.6 V; voltages below that value generated lower optical powers while having higher RMS errors.
APPENDIX B
We start by building what is called a half lens #1 sandwich [presented in the bottom of Fig.?
We used a commercial Shack-Hartmann wave-front sensor (WFS150-7AR, Thorlabs) to measure the focal distance and the optical aberrations of the TLCL [Fig.?
Fluorescent beads (FSEG004, Bangs Laboratories, Inc.) were immersed into water and mounted between a standard microscope slice and a thin (4?μm) cover glass. Beads were first mechanically defocused using a motorized actuator and then electrically brought back into the focus using the TLCL. The precisely known mechanically out-of-focused distance corresponded to the compensatory electrical shift produced by the TLCL.
TLCL was used to electrically modulate the working distance of the probe. For each shift value, fluorescent beads were mechanically scanned by steps of 3?μm to generate a 3D point spread function (PSF) stack. The resolution of the system (for each shift value) was determined by using the MetroloJ plug-in (ImageJ) that measured the full width at half-maximum (FWHM) of the experimental PSF.
All animal experiments were approved by the Animal Welfare Committee of CHU de Québec and Université Laval in accordance with the Canadian Council on Animal Care policy. We used 2-month old male or female VGluT2-IRES-Cre transgenic mice (The Jackson Laboratory, RRID: IMSR_JAX:016963). All mice were either housed alone or with a single sibling after the surgery.
Aseptic surgery was performed under isoflurane anesthesia (1%–2%). All pressure points and incision sites were injected subcutaneously with lidocaine-bupivacaine (7.5?mg/kg) for local analgesia. Slow released buprenorphin (1?mg/kg) was administered subcutaneously for post-surgical analgesia. The skull was exposed to do a craniotomy (about 1?mm in diameter) above the motor cortex. The dura mater was removed prior to viral injection. A glass micropipette (ID 0.53?mm, OD, 1.19?mm, WPI) mounted on a nano-injector (Nanoliter 2010 injector with SMARTouch controller, WPI) was filled with AAV2.9/em-CAG-Flex-GCaMP6s (titer 1.2E13?GC/mL) and inserted into the motor cortex to deliver 70 to 100?nL in 2–4 locations within the following stereotaxic coordinates: anteroposterior –0.3 to 0.3?mm from Bregma, lateral 0.8 to 1?mm, depth 0.8?mm. The flow rate was 30?nL/min and after completion, the micropipette was held in place for at least 2?min to prevent leakage. The craniotomy was filled with a hemostat (Bonewax) and the skin above the skull sutured. After a waiting time of at least 3 weeks was allowed for a robust expression of the GCaMP6s, mice were instrumented with a GRIN lens during a second aseptic surgery. The implant was secured with self-tapping bone screws (cat# 19010-10, FST), crazy glue (exact type), and dental cement (cat# 525000, A-M Systems). Mice were allowed to recover for at least a week before chronic experiments.
To carefully connect the miniscope, animals were anesthetized with isoflurane (2%). Mice were first habituated to the headpiece fixation for 3 days, 30?min per day. Portability test consisted of 4 imaging sessions spread over a two-week period.
At the beginning of each imaging session, headpiece fixation was followed by a resting period of 5?min. During each imaging session, the movement of the animal was recorded for 42?min at 30?fps. Imaging session was initiated from software. Mice were allowed to roam free in an open field during imaging without direct contact with the experimenter. Calcium activity in the motor cortex neurons was monitored while recovering from anesthesia, during spontaneous activity such as grooming and during treadmill locomotion.
Images were analysed using MATLAB and ImageJ. In MATLAB, we used Miniscope 1-Photon Based Calcium Imaging Signal Extraction Pipeline (MIN1PIPE). The image processing with MIN1PIPE involved motion correction (if required), manual ROI selection, and calcium signal extraction. Correlation matrices were done in MATLAB. ImageJ was used for background subtraction and brightness adjustment. DeconvolutionLab2 plug-in was used for the deconvolution based on the experimental PSF stacks.
References
[1] D. Miyamoto, M. Murayama. The fiber-optic imaging and manipulation of neural activity during animal behavior. Neurosci. Res., 103, 1-9(2016).
[2] D. Aharoni, T. M. Hoogland. Circuit investigations with open-source miniaturized microscopes: past, present and future. Front. Cell. Neurosci., 13, 141(2019).
[3] W. Yang, R. Yuste.
[4] F.-J. Kao, W. Zong, L. Chen, G. Keiser, A. Gogoi. Advanced miniature microscopy for brain imaging. Advanced Optical Methods for Brain Imaging, 167-187(2019).
[5] J. Oh, C. Lee, B.-K. Kaang. Imaging and analysis of genetically encoded calcium indicators linking neural circuits and behaviors. Korean J. Phys. Pharmacol., 23, 237-249(2019).
[6] I. Mollinedo-Gajate, C. Song, T. Knöpfel. Genetically encoded fluorescent calcium and voltage indicators. Handb. Exp. Pharmacol., 260, 209-229(2019).
[7] E. Greotti, D. De Stefani. Biosensors for detection of calcium. Methods Cell Biol., 155, 337-368(2020).
[8] J. Voigts, M. T. Harnett. An animal-actuated rotational head-fixation system for 2-photon imaging during 2-d navigation(2018).
[9] W. Mittmann, D. J. Wallace, U. Czubayko, J. T. Herb, A. T. Schaefer, L. L. Looger, W. Denk, J. N. D. Kerr. Two-photon calcium imaging of evoked activity from L5 somatosensory neurons
[10] R. Li, M. Wang, J. Yao, S. Liang, X. Liao, M. Yang, J. Zhang, J. Yan, H. Jia, X. Chen, X. Li. Two-photon functional imaging of the auditory cortex in behaving mice: from neural networks to single spines. Front. Neural Circuits, 12, 33(2018).
[11] P. Ravassard, A. Kees, B. Willers, D. Ho, D. A. Aharoni, J. Cushman, Z. M. Aghajan, M. R. Mehta. Multisensory control of hippocampal spatiotemporal selectivity. Science, 340, 1342-1346(2013).
[12] Z. M. Aghajan, L. Acharya, J. J. Moore, J. D. Cushman, C. Vuong, M. R. Mehta. Impaired spatial selectivity and intact phase precession in two-dimensional virtual reality. Nat. Neurosci., 18, 121-128(2015).
[13] K. Thurley, A. Ayaz. Virtual reality systems for rodents. Curr. Zool., 63, 109-119(2017).
[14] R. van den Brand, J. Heutschi, Q. Barraud, J. DiGiovanna, K. Bartholdi, M. Huerlimann, L. Friedli, I. Vollenweider, E. M. Moraud, S. Duis, N. Dominici, S. Micera, P. Musienko, G. Courtine. Restoring voluntary control of locomotion after paralyzing spinal cord injury. Science, 336, 1182-1185(2012).
[15] U. Sławińska, H. Majczyński, Y. Dai, L. M. Jordan. The upright posture improves plantar stepping and alters responses to serotonergic drugs in spinal rats. J. Physiol., 590, 1721-1736(2012).
[16] B. N. Ozbay, G. L. Futia, M. Ma, V. M. Bright, J. T. Gopinath, E. G. Hughes, D. Restrepo, E. A. Gibson. Three dimensional two-photon brain imaging in freely moving mice using a miniature fiber coupled microscope with active axial-scanning. Sci. Rep., 8, 8108(2018).
[17] F. Helmchen, W. Denk, J. N. D. Kerr. Miniaturization of two-photon microscopy for imaging in freely moving animals. Cold Spring Harb. Protoc., 2013, 904-913(2013).
[18] D. R. Rivera, C. M. Brown, D. G. Ouzounov, I. Pavlova, D. Kobat, W. W. Webb, C. Xu. Compact and flexible raster scanning multiphoton endoscope capable of imaging unstained tissue. Proc. Natl. Acad. Sci. USA, 108, 17598-17603(2011).
[19] F. Helmchen, M. S. Fee, D. W. Tank, W. Denk. A miniature head-mounted two-photon microscope: high-resolution brain imaging in freely moving animals. Neuron, 31, 903-912(2001).
[20] Y. Zhang, M. L. Akins, K. Murari, J. Xi, M.-J. Li, K. Luby-Phelps, M. Mahendroo, X. Li. A compact fiber-optic SHG scanning endomicroscope and its application to visualize cervical remodeling during pregnancy. Proc. Natl. Acad. Sci. USA, 109, 12878-12883(2012).
[21] W. Piyawattanametha, E. D. Cocker, L. D. Burns, R. P. J. Barretto, J. C. Jung, H. Ra, O. Solgaard, M. J. Schnitzer.
[22] W. Zong, R. Wu, M. Li, Y. Hu, Y. Li, J. Li, H. Rong, H. Wu, Y. Xu, Y. Lu, H. Jia, M. Fan, Z. Zhou, Y. Zhang, A. Wang, L. Chen, H. Cheng. Fast high-resolution miniature two-photon microscopy for brain imaging in freely behaving mice. Nat. Methods, 14, 713-719(2017).
[23] B. N. Ozbay, J. T. Losacco, R. Cormack, R. Weir, V. M. Bright, J. T. Gopinath, D. Restrepo, E. A. Gibson. Miniaturized fiber-coupled confocal fluorescence microscope with an electrowetting variable focus lens using no moving parts. Opt. Lett., 40, 2553-2556(2015).
[24] O. Mano, M. S. Creamer, C. A. Matulis, E. Salazar-Gatzimas, J. Chen, J. A. Zavatone-Veth, D. A. Clark. Using slow frame rate imaging to extract fast receptive fields. Nat. Commun., 10, 4979(2019).
[25] S. A. Lee, K. S. Holly, V. Voziyanov, S. L. Villalba, R. Tong, H. E. Grigsby, E. Glasscock, F. G. Szele, I. Vlachos, T. A. Murray. Gradient index microlens implanted in prefrontal cortex of mouse does not affect behavioral test performance over time. PLoS ONE, 11, e0146533(2016).
[26] W. A. Liberti, L. N. Perkins, D. P. Leman, T. J. Gardner. An open source, wireless capable miniature microscope system. J. Neural Eng., 14, 045001(2017).
[27] K. K. Ghosh, L. D. Burns, E. D. Cocker, A. Nimmerjahn, Y. Ziv, A. E. Gamal, M. J. Schnitzer. Miniaturized integration of a fluorescence microscope. Nat. Methods, 8, 871-878(2011).
[28] D. J. Cai, D. Aharoni, T. Shuman, J. Shobe, J. Biane, W. Song, B. Wei, M. Veshkini, M. La-Vu, J. Lou, S. E. Flores, I. Kim, Y. Sano, M. Zhou, K. Baumgaertel, A. Lavi, M. Kamata, M. Tuszynski, M. Mayford, P. Golshani, A. J. Silva. A shared neural ensemble links distinct contextual memories encoded close in time. Nature, 534, 115-118(2016).
[29] A. Bagramyan. Lightweight 1-photon miniscope for imaging in freely behaving animals at subcellular resolution. IEEE Photon. Technol. Lett., 32, 909-912(2020).
[30] J. I. Arellano, R. Benavides-Piccione, J. DeFelipe, R. Yuste. Ultrastructure of dendritic spines: correlation between synaptic and spine morphologies. Front. Neurosci., 1, 131-143(2007).
[31] W. M. Lee, S. H. Yun. Adaptive aberration correction of GRIN lenses for confocal endomicroscopy. Opt. Lett., 36, 4608-4610(2011).
[32] A. Bagramyan, T. Galstian. Dynamic control of polarization mismatch and coma aberrations in rod-GRIN assemblies. Opt. Express, 27, 14144-14151(2019).
[33] T. V. Galstian. Smart Mini-Cameras(2013).
[34] B. F. Grewe, F. F. Voigt, M. van ’t Hoff, F. Helmchen. Fast two-layer two-photon imaging of neuronal cell populations using an electrically tunable lens. Biomed. Opt. Express, 2, 2035(2011).
[35] P.-G. de Gennes, J. Prost. The Physics of Liquid Crystals(1993).
[36] T. Galstian, K. Asatryan, V. Presniakov, A. Zohrabyan, A. Tork, A. Bagramyan, S. Careau, M. Thiboutot, M. Cotovanu. High optical quality electrically variable liquid crystal lens using an additional floating electrode. Opt. Lett., 41, 3265-3268(2016).
[37] T. Galstian, O. Sova, K. Asatryan, V. Presniakov, A. Zohrabyan, M. Evensen. Optical camera with liquid crystal autofocus lens. Opt. Express, 25, 29945-29964(2017).
[38] A. Bagramyan, T. Galstian, A. Saghatelyan. Motion-free endoscopic system for brain imaging at variable focal depth using liquid crystal lenses. J. Biophoton., 10, 762-774(2017).
[39] L. Li, L. Xiao, J.-H. Wang, Q.-H. Wang. Movable electrowetting optofluidic lens for optical axial scanning in microscopy. Opto-Electron. Adv., 02, 180025(2019).
[40] L. Li, D. Wang, C. Liu, Q.-H. Wang. Zoom microscope objective using electrowetting lenses. Opt. Express, 24, 2931-2940(2016).
[41] G. Barbera, B. Liang, L. Zhang, C. R. Gerfen, E. Culurciello, R. Chen, Y. Li, D.-T. Lin. Spatially compact neural clusters in the dorsal striatum encode locomotion relevant information. Neuron, 92, 202-213(2016).
[42] M. Carlén, R. M. Cassidy, H. Brismar, G. A. Smith, L. W. Enquist, J. Frisén. Functional integration of adult-born neurons. Curr. Biol., 12, 606-608(2002).
[43] D. L. Dickstein, C. M. Weaver, J. I. Luebke, P. R. Hof. Dendritic spine changes associated with normal aging. Neuroscience, 251, 21-32(2013).
[44] Y. Smith, R. M. Villalba, D. V. Raju. Striatal spine plasticity in Parkinson’s disease: pathological or not?. Parkinsonism Relat. Disord., 15, S156-S161(2009).
[45] T. Bittner, M. Fuhrmann, S. Burgold, S. M. Ochs, N. Hoffmann, G. Mitteregger, H. Kretzschmar, F. M. LaFerla, J. Herms. Multiple events lead to dendritic spine loss in triple transgenic Alzheimer’s disease mice. PLoS ONE, 5, e15477(2010).
[46] M. Balbi, M. P. Vanni, G. Silasi, Y. Sekino, L. Bolanos, J. M. LeDue, T. H. Murphy. Targeted ischemic stroke induction and mesoscopic imaging assessment of blood flow and ischemic depolarization in awake mice. Neurophotonics, 4, 035001(2017).

Set citation alerts for the article
Please enter your email address
© Copyright 2018-2021 | Chinese Laser Press. All Rights Reserved 沪ICP备15018463号-20