
Xiaoguo Chen, Jinquan Hu. Underwater Image Enhancement Based on Color Correction and Detail Preservation[J]. Laser & Optoelectronics Progress, 2020, 57(24): 241013
- Laser & Optoelectronics Progress
- Vol. 57, Issue 24, 241013 (2020)
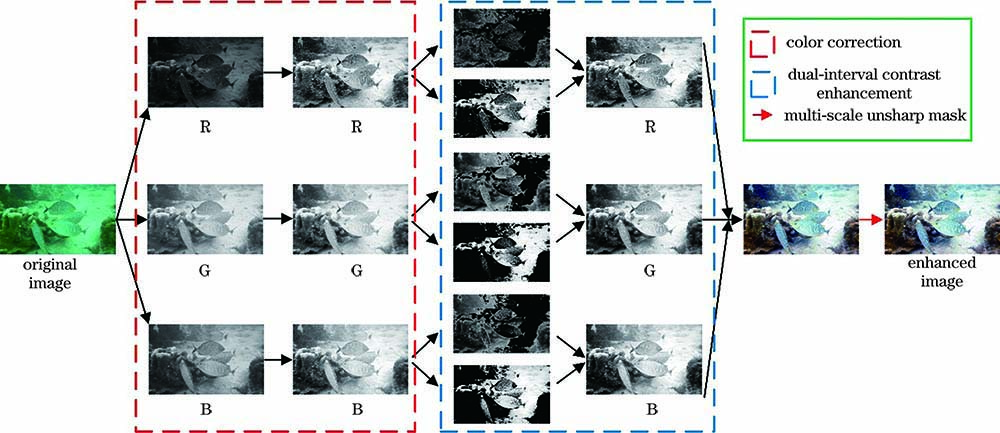
Fig. 1. Flowchart of the proposed method
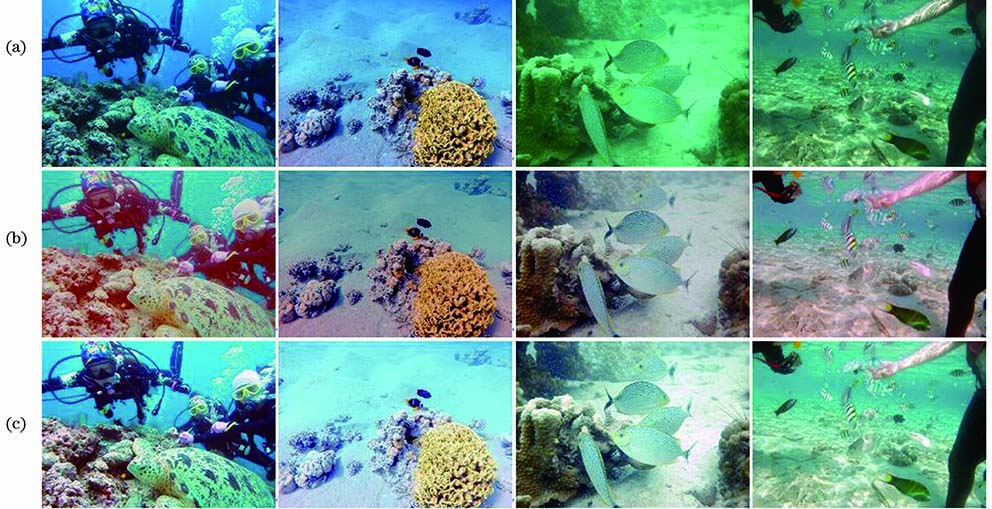
Fig. 2. Color correction results. (a) Raw images; (b) color correction method based on mean and variance; (c) proposed color correction method
Fig. 3. Process of separating and integrating low-enhanced and upper-enhanced regions
Fig. 4. Detail sharpen results. (a) Original image; (b) contrast enhanced image; (c) detail sharpened image
Fig. 5. Evaluation of color correction。(a) Original image; (b) method in Ref.[1]; (c) method in Ref.[5]; (d) method in Ref.[9]; (e) method in Ref.[15]; (f) method in Ref.[16]; (g) method in Ref.[18]; (h) proposed method
Fig. 6. Evaluation on bluish underwater images.(a) Original image; (b) method in Ref.[1]; (c) method in Ref.[5]; (d) method in Ref.[9]; (e) method in Ref.[15]; (f) method in Ref.[16]; (g) method in Ref.[18]; (h) proposed method
Fig. 7. Evaluation on greenish underwater images. (a) Original image; (b) method in Ref.[1]; (c) method in Ref.[5]; (d) method in Ref.[9]; (e) method in Ref.[15]; (f) method in Ref.[16]; (g) method in Ref.[18]; (h) proposed method
Fig. 8. Evaluation on yellowish underwater images. (a) Original image; (b) method in Ref.[1]; (c) method in Ref.[5]; (d) method in Ref.[9]; (e) method in Ref.[15]; (f) method in Ref.[16]; (g) method in Ref.[18]; (h) proposed method
Fig. 9. Evaluation on low light images
| ||||||||||||||||||||||||||||||||||||||||||||||||||||||||||||||||||||||||||||||||||||||||||||||||||||||||||||||||||||||||||||||||||||||||||||||||||||||||||||||||||||||||||||||||||||||||||||||||||||||||||||||||||||||||||||||||||||||
Table 1. AG and UCIQE under different methods

Set citation alerts for the article
Please enter your email address
© Copyright 2018-2021 | Chinese Laser Press. All Rights Reserved 沪ICP备15018463号-20