Author Affiliations
School of Electronic and Information Engineering, Lanzhou Jiaotong University, Lanzhou, Gansu 730070, Chinashow less
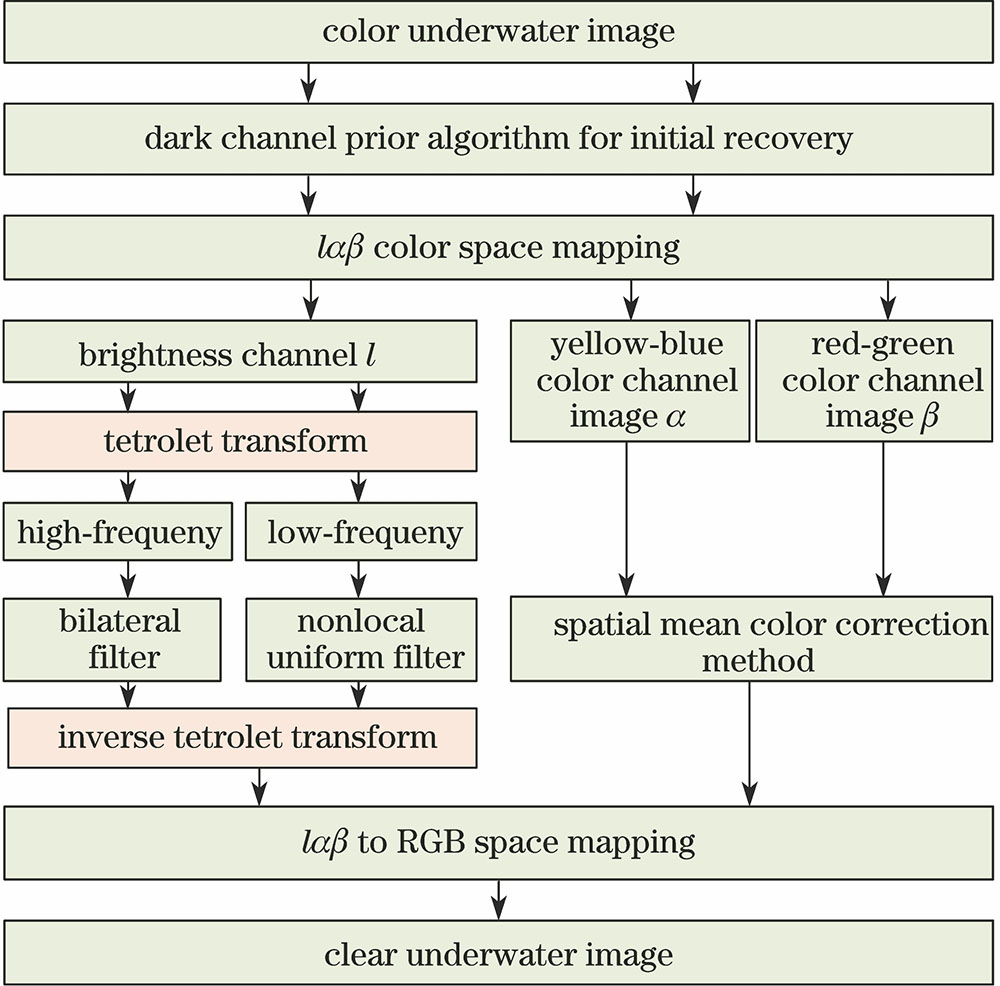
Fig. 1. Flow chart of the proposed algorithm
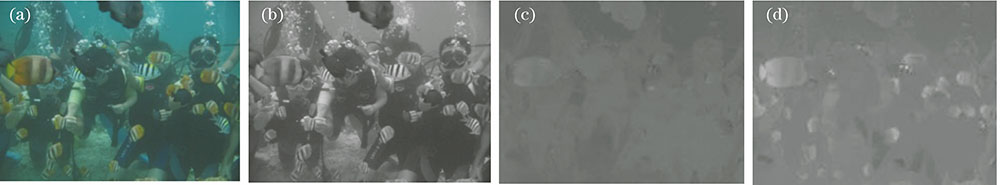
Fig. 2. Maping underwater color image to lαβ three channels. (a) Original image; (b) l channel; (c) α channel; (d) β channel
Fig. 3. Five basic tetrominoes
Fig. 4. Structure diagram of Tetrolet transformation
Fig. 5. Comparison of high-frequency details. (a) Tetrolet transform; (b) improved Tetrolet transform
Fig. 6. Effects on image edge of bilateral filtering. (a) Image region with noises; (b) value domain filtering; (c) bilateral filtering; (d) spatial domain filtering; e) filtering combination of spatial domain and value domain
Fig. 7. Images before and after Tetrolet processing. (a) Original images; (b) after Tetrolet processing
Fig. 8. Comparison of experiment results. (a) Original images; (b) Retinex method; (c) three-channel method; (d) proposed method
Image1 | SD | AvG | K | PSNR |
---|
Original image | 21.9478 | 3.2446 | 11.4797 | | Retinex method | 59.3020 | 8.7878 | 11.7245 | 18.7463 | Three-channel method | 64.9892 | 10.5367 | 11.0100 | 22.0152 | Proposed method | 69.1260 | 14.0523 | 10.7489 | 40.9846 |
|
Table 1. Quantitative results comparison of three methods in Image1
Image2 | SD | AvG | K | PSNR |
---|
Original image | 37.4333 | 3.0789 | 22.7547 | | Retinex method | 67.7373 | 5.6715 | 23.0091 | 24.4258 | Three-channel method | 70.8437 | 6.3833 | 20.7889 | 31.5185 | Proposed method | 75.8796 | 16.1642 | 17.5998 | 43.8117 |
|
Table 2. Quantitative results comparison of three methods in Image2
Image3 | SD | AvG | K | PSNR |
---|
Original image | 22.1821 | 4.5231 | 33.9549 | | Retinex method | 60.0284 | 12.1882 | 33.1598 | 13.8773 | Three-channel method | 64.7879 | 15.7308 | 32.0912 | 27.8534 | Proposed method | 68.6630 | 15.9291 | 26.9135 | 39.2829 |
|
Table 3. Quantitative results comparison of three methods in Image3
Image4 | SD | AvG | K | PSNR |
---|
Original image | 30.3121 | 3.5554 | 12.9045 | | Retinex method | 58.0390 | 6.8081 | 13.1663 | 19.6965 | Three-channel method | 70.8671 | 9.2744 | 13.0921 | 39.1319 | Proposed method | 73.3712 | 16.3484 | 13.6548 | 41.8504 |
|
Table 4. Quantitative results comparison of three methods in Image4
Image5 | SD | AvG | K | PSNR |
---|
Original image | 35.2730 | 1.8218 | 13.2963 | | Retinex method | 63.5605 | 3.4165 | 13.5406 | 20.0278 | Three-channel method | 74.8518 | 4.4201 | 12.1948 | 32.1510 | Proposed method | 55.7041 | 15.9609 | 13.2990 | 41.4206 |
|
Table 5. Quantitative results comparison of three methods in Image5
Image6 | SD | AvG | K | PSNR |
---|
Original image | 41.3750 | 5.0257 | 15.0149 | | Retinex method | 74.2653 | 9.0967 | 14.6459 | 16.4409 | Three-channel method | 74.8739 | 9.5739 | 13.5683 | 31.4975 | Proposed method | 66.9649 | 20.8972 | 11.5868 | 42.6501 |
|
Table 6. Quantitative results comparison of three methods in Image6
Image7 | SD | AvG | K | PSNR |
---|
Original image | 34.2729 | 4.9122 | 10.0089 | | Retinex method | 63.3974 | 9.2870 | 10.0493 | 11.7240 | Three-channel method | 74.8534 | 11.1896 | 9.4062 | 36.0456 | Proposed method | 72.8994 | 18.3051 | 9.3474 | 38.6173 |
|
Table 7. Quantitative results comparison of three methods in Image7
Image8 | SD | AvG | K | PSNR |
---|
Original image | 23.2133 | 4.9122 | 10.0089 | | Retinex method | 55.7064 | 13.2975 | 9.1934 | 18.8354 | Three-channel method | 74.7517 | 17.6959 | 6.7261 | 40.1223 | Proposed method | 59.8865 | 15.7695 | 6.5751 | 44.0395 |
|
Table 8. Quantitative results comparison of three methods in Image8