Author Affiliations
1 College of Information and Communication Engineering, Harbin Engineering University, Harbin, Heilongjiang 150001, China1 School of Communication and Electronic Engineering, Qingdao University of Technology, Qingdao, Shandong 266520, China1 School of Rail Transit, Guangdong Communication Polytechnic, Guangzhou, Guangdong 510650, Chinashow less
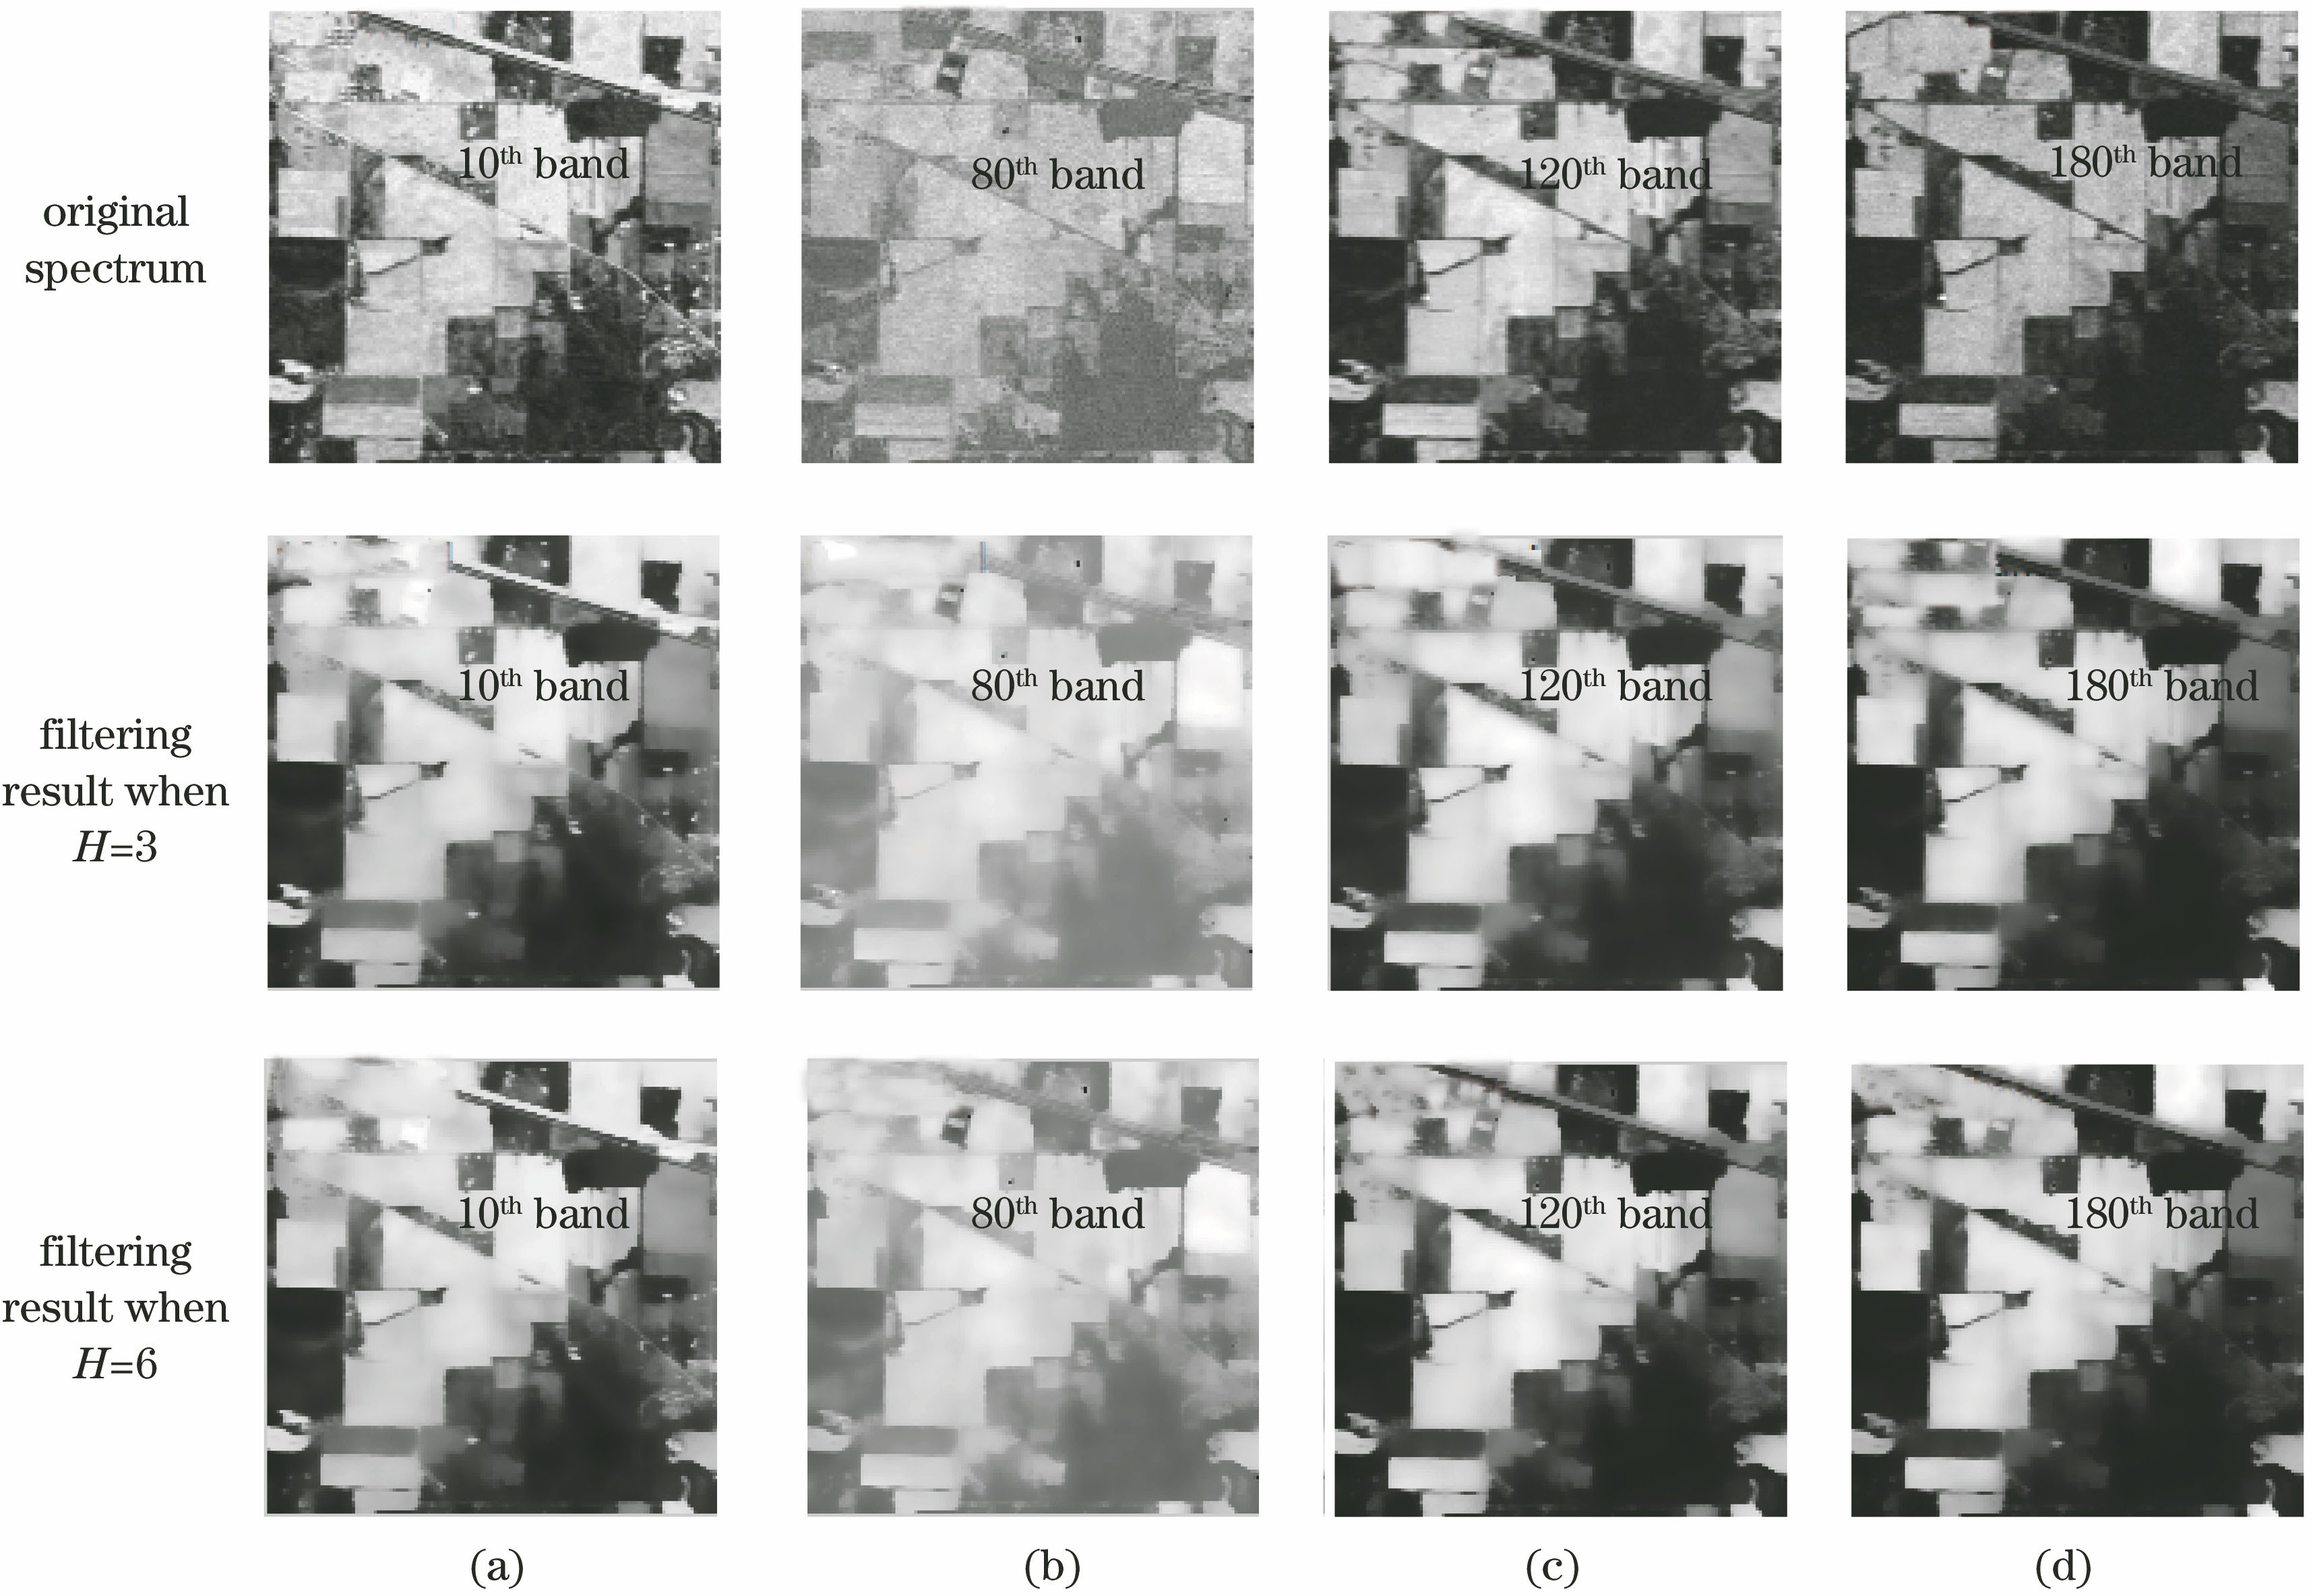
Fig. 1. Original spectrum and filtering results of Indian Pines data sets. (a) 10th band; (b) 80th band; (c) 120th band; (d) 180th band
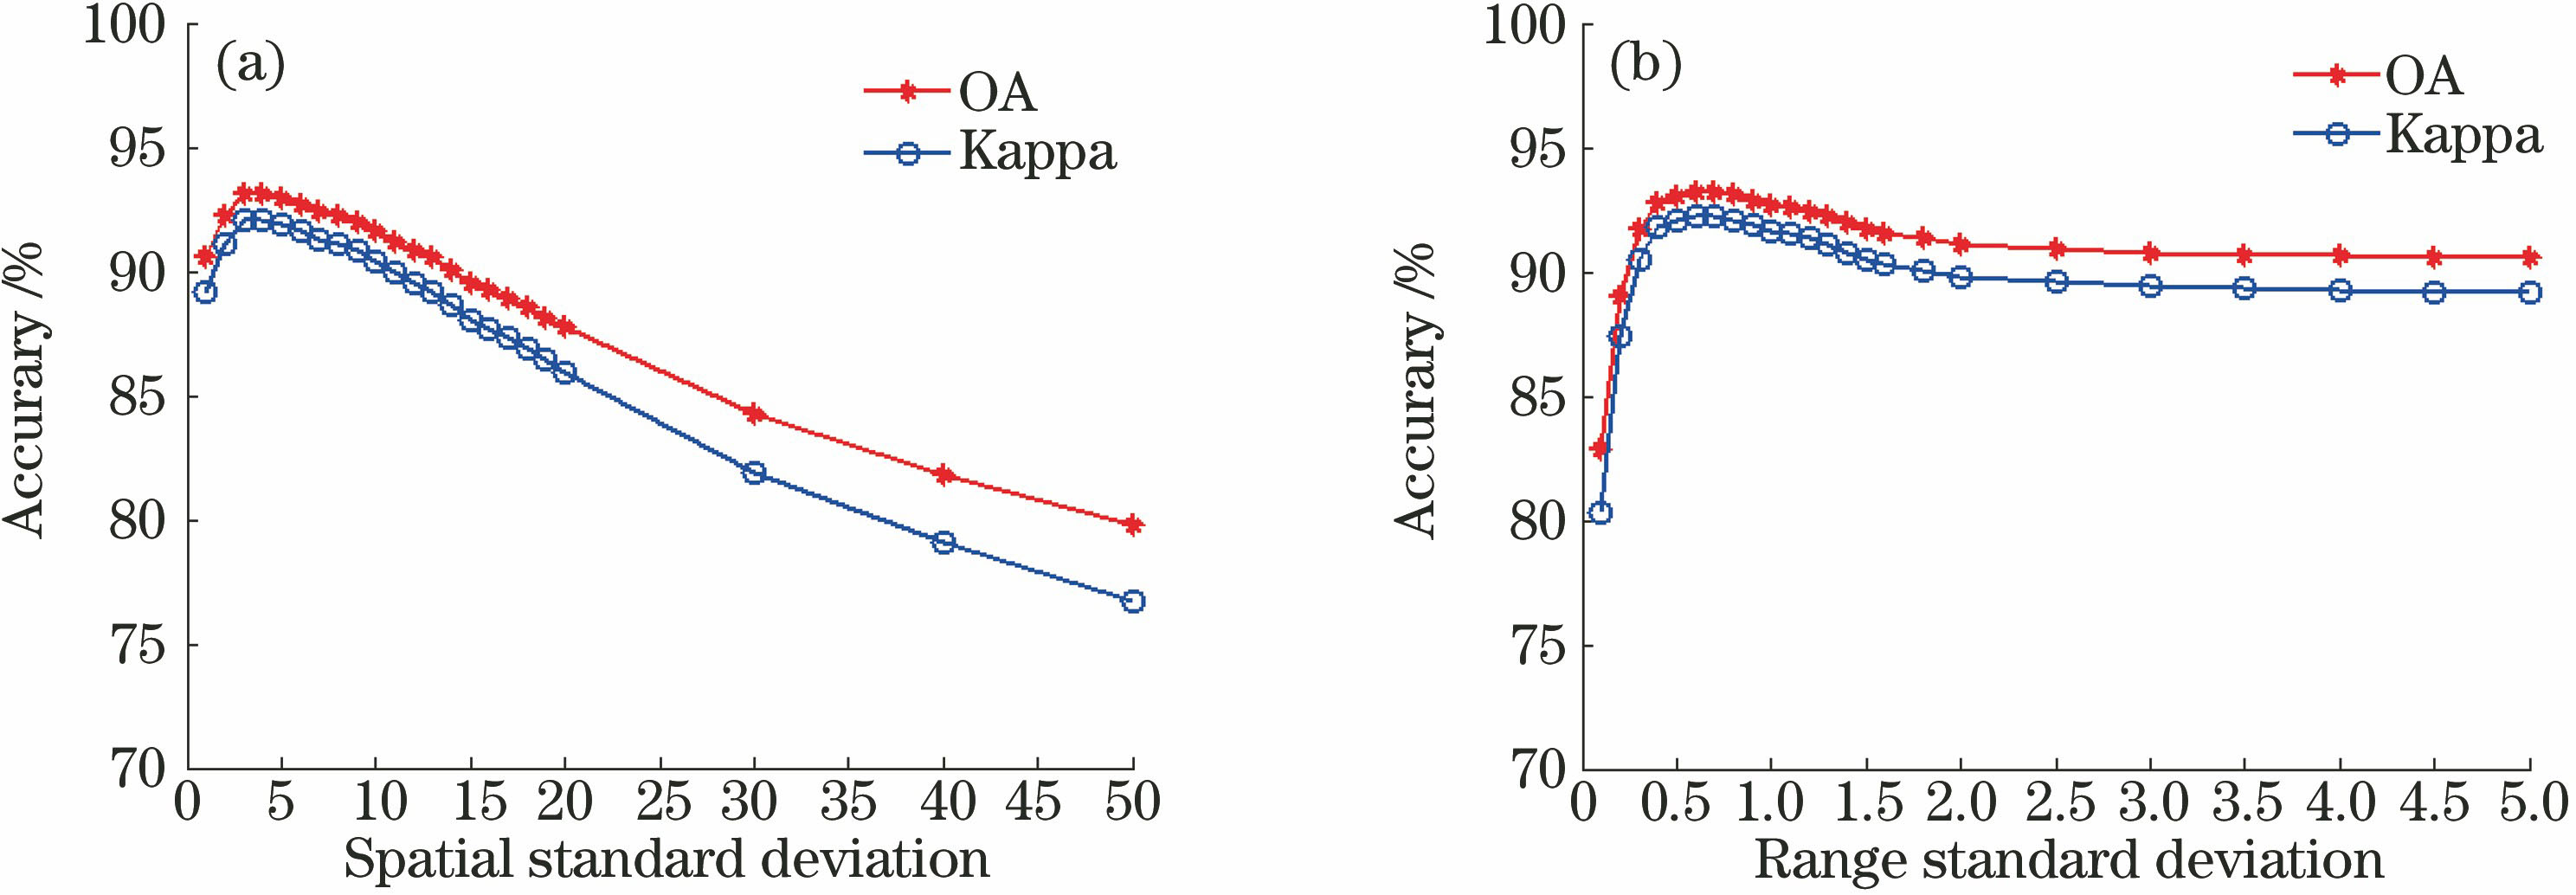
Fig. 2. Optimization for manifold filtering coefficient of Indian Pines data sets. (a) Spatial deviation coefficient σs; (b) range deviation coefficient σr
Fig. 3. Flow of AMF-SVM
Fig. 4. Classification of Indian Pines data sets. (a) Ground truth; (b) SVM, OA is 80.93%; (c) SVM-PCA, OA is 80.46%; (d) GBF-SVM, OA is 82.82%; (e) BF-SVM, OA is 88.99%; (f) GDF-SVM, OA is 91.08%; (g) EPF-B-g, OA is 92.99%; (h) EPF-G-g, OA is 92.83%; (i) IFRF, OA is 93.64%; (j) AMF-SVM, OA is 95.16%
Fig. 5. Classification for Pavia University. (a) Ground truth;(b) SVM, OA is 84.80%; (c) SVM-PCA, OA is 83.95%; (d) GBF-SVM, OA is 85.20%; (e) BF-SVM, OA is 89.03%; (f) GDF-SVM, OA is 94.20%; (g) EPF-B-g, OA is 91.29%; (h) EPF-G-g, OA is 91.68%; (i) IFRF, OA is 95.31%; (j) AMF-SVM, OA is 97.92%
Fig. 6. Charts of OA and Kappa coefficient with different training samples. (a) Indian Pines; (b) Pavia University
Fig. 7. OA and Kappa coefficient for different classification methods. (a) 1% training sample for Indian Pins; (b) 0.1% training sample for Pavia University
Fig. 8. Optimization for hyperspectral classification of adaptive manifold filtering. (a) Indian Pins; (b) Pavia University
| Groundtruth | SumsampleNo. | TrainsampleNo. /% | TestsampleNo. /% | SVM /% | SVM-PCA /% | GBF-SVM /% | BF-SVM /% | GDF-SVM /% | EPF-B-g /% | EPF-G-g /% | IFRF /% | AMF-SVM /% |
|---|
| Alfalfa | 54 | 7 | 93 | 83.57 | 78.89 | 88.83 | 91.86 | 91.10 | 95.58 | 94.78 | 91.34 | 92.24 | | Corn-no till | 1434 | 7 | 93 | 71.50 | 71.08 | 76.46 | 84.28 | 87.25 | 91.57 | 91.39 | 91.23 | 96.95 | | Corn-min till | 834 | 7 | 93 | 70.63 | 72.02 | 70.38 | 88.93 | 91.67 | 87.34 | 87.54 | 84.64 | 97.90 | | Corn | 234 | 7 | 93 | 44.19 | 41.48 | 51.61 | 57.98 | 66.21 | 62.57 | 61.39 | 86.22 | 87.16 | | Grass/pasture | 497 | 7 | 93 | 89.90 | 89.12 | 88.96 | 92.29 | 93.60 | 95.48 | 94.82 | 93.96 | 93.58 | | Grass/trees | 747 | 7 | 93 | 94.79 | 94.63 | 95.15 | 96.79 | 96.86 | 99.79 | 99.50 | 98.10 | 97.40 | | Grass/pasture-mowed | 26 | 7 | 93 | 53.91 | 53.27 | 66.50 | 62.45 | 64.31 | 54.19 | 62.80 | 88.13 | 76.67 | | Hay-windrowed | 489 | 7 | 93 | 97.16 | 96.18 | 99.56 | 98.33 | 97.47 | 100.0 | 100.0 | 99.58 | 99.16 | | Oats | 20 | 7 | 93 | 46.99 | 47.52 | 75.94 | 57.46 | 62.42 | 22.69 | 39.34 | 89.47 | 94.07 | | Soybeans-no till | 968 | 7 | 93 | 69.29 | 68.28 | 67.89 | 83.05 | 84.41 | 87.59 | 86.21 | 87.14 | 92.83 | | Soybeans-min till | 2468 | 7 | 93 | 85.12 | 84.43 | 86.88 | 91.70 | 93.68 | 97.71 | 97.51 | 95.96 | 98.51 | | Soybeans-clean till | 614 | 7 | 93 | 79.40 | 78.41 | 74.90 | 87.71 | 90.03 | 95.67 | 95.88 | 95.24 | 96.58 | | Wheat | 212 | 7 | 93 | 95.98 | 96.53 | 97.00 | 97.38 | 97.58 | 99.95 | 99.60 | 99.34 | 98.38 | | Woods | 1294 | 7 | 93 | 97.67 | 97.97 | 98.19 | 98.08 | 98.59 | 99.94 | 99.81 | 98.84 | 99.01 | | Bldg-Grass-Tree | 380 | 7 | 93 | 45.94 | 43.59 | 68.51 | 64.42 | 74.86 | 60.16 | 61.26 | 91.16 | 78.77 | | Stone-steeltowers | 95 | 7 | 93 | 76.42 | 76.16 | 71.16 | 76.42 | 81.82 | 93.35 | 97.73 | 83.37 | 82.04 | | OA /% | - | - | - | 80.93 | 80.46 | 82.82 | 88.99 | 91.08 | 92.99 | 92.83 | 93.62 | 96.16 | | Kappa | - | - | - | 78.12 | 77.58 | 80.28 | 87.41 | 89.81 | 91.96 | 91.78 | 92.11 | 95.62 |
|
Table 1. Classification data statistics of Indian Pines data sets
| Groundtruth | Sum | Train /% | Test /% | SVM /% | SVM-PCA /% | GBF-SVM /% | BF-SVM /% | GDF-SVM /% | EPF-B-g /% | EPF-G-g /% | IFRF /% | AMF-SVM /% |
|---|
| Asphalt | 6641 | 2 | 98 | 87.84 | 86.19 | 88.74 | 88.23 | 94.98 | 98.07 | 97.49 | 97.70 | 98.68 | | Meadows | 18649 | 2 | 98 | 95.81 | 95.99 | 96.13 | 97.03 | 98.32 | 99.98 | 99.91 | 99.34 | 99.79 | | Gravel | 2099 | 2 | 98 | 57.87 | 48.76 | 54.51 | 65.01 | 76.07 | 72.60 | 69.39 | 86.68 | 90.63 | | Trees | 3064 | 2 | 98 | 88.17 | 85.01 | 89.21 | 91.98 | 96.19 | 91.84 | 92.26 | 92.78 | 96.56 | | Metalsheets | 1345 | 2 | 98 | 98.34 | 98.72 | 98.84 | 97.54 | 98.38 | 99.85 | 99.94 | 99.02 | 99.40 | | Soil | 5029 | 2 | 98 | 54.33 | 54.96 | 56.21 | 77.91 | 88.34 | 60.74 | 60.32 | 99.86 | 97.59 | | Bitumen | 1330 | 2 | 98 | 64.64 | 64.79 | 65.89 | 70.50 | 82.89 | 81.27 | 86.38 | 96.37 | 95.12 | | Bricks | 3682 | 2 | 98 | 78.97 | 79.41 | 77.88 | 80.18 | 91.43 | 98.47 | 95.95 | 73.13 | 97.05 | | Shadows | 947 | 2 | 98 | 89.33 | 84.29 | 90.64 | 87.82 | 93.37 | 95.13 | 93.20 | 83.10 | 94.49 | | OA /% | - | - | - | 84.80 | 83.96 | 85.20 | 89.03 | 94.20 | 92.32 | 91.92 | 95.31 | 98.17 | | Kappa | - | - | - | 79.47 | 78.31 | 80.00 | 85.34 | 92.29 | 89.57 | 89.04 | 93.67 | 97.57 |
|
Table 2. Classification statistics of Pavia University data sets
| Index | n | 0 | 1 | 2 | 3 | 4 | 5 | 6 | 7 | 8 |
|---|
| Tree height | 2 | 3 | 4 | 5 | 6 | 7 | 8 | 9 | 10 |
|---|
| Tree node | 3 | 7 | 15 | 31 | 63 | 127 | 255 | 511 | 1023 | | Indian Pines | OA /% | 95.61 | 95.67 | 95.97 | 95.61 | 95.80 | 96.15 | 96.04 | 96.16 | 96.13 | | Kappa | 94.98 | 95.05 | 95.39 | 94.99 | 95.20 | 95.61 | 95.47 | 95.62 | 95.58 | | Pavia | OA /% | 98.02 | 98.19 | 98.14 | 98.20 | 98.08 | 98.17 | 98.40 | 98.29 | 98.17 | | Kappa | 97.37 | 97.60 | 97.53 | 97.62 | 97.45 | 97.58 | 97.88 | 97.73 | 97.57 |
|
Table 3. Hyperspectral classification data statistics of adaptive manifold filtering