
Quan Xu, Xueqian Zhang, Yuehong Xu, Chunmei Ouyang, Yanfeng Li, Jiaguang Han, Weili Zhang. Near-field manipulation of terahertz surface waves by metasurfaces [Invited][J]. Chinese Optics Letters, 2018, 16(5): 050002
- Chinese Optics Letters
- Vol. 16, Issue 5, 050002 (2018)
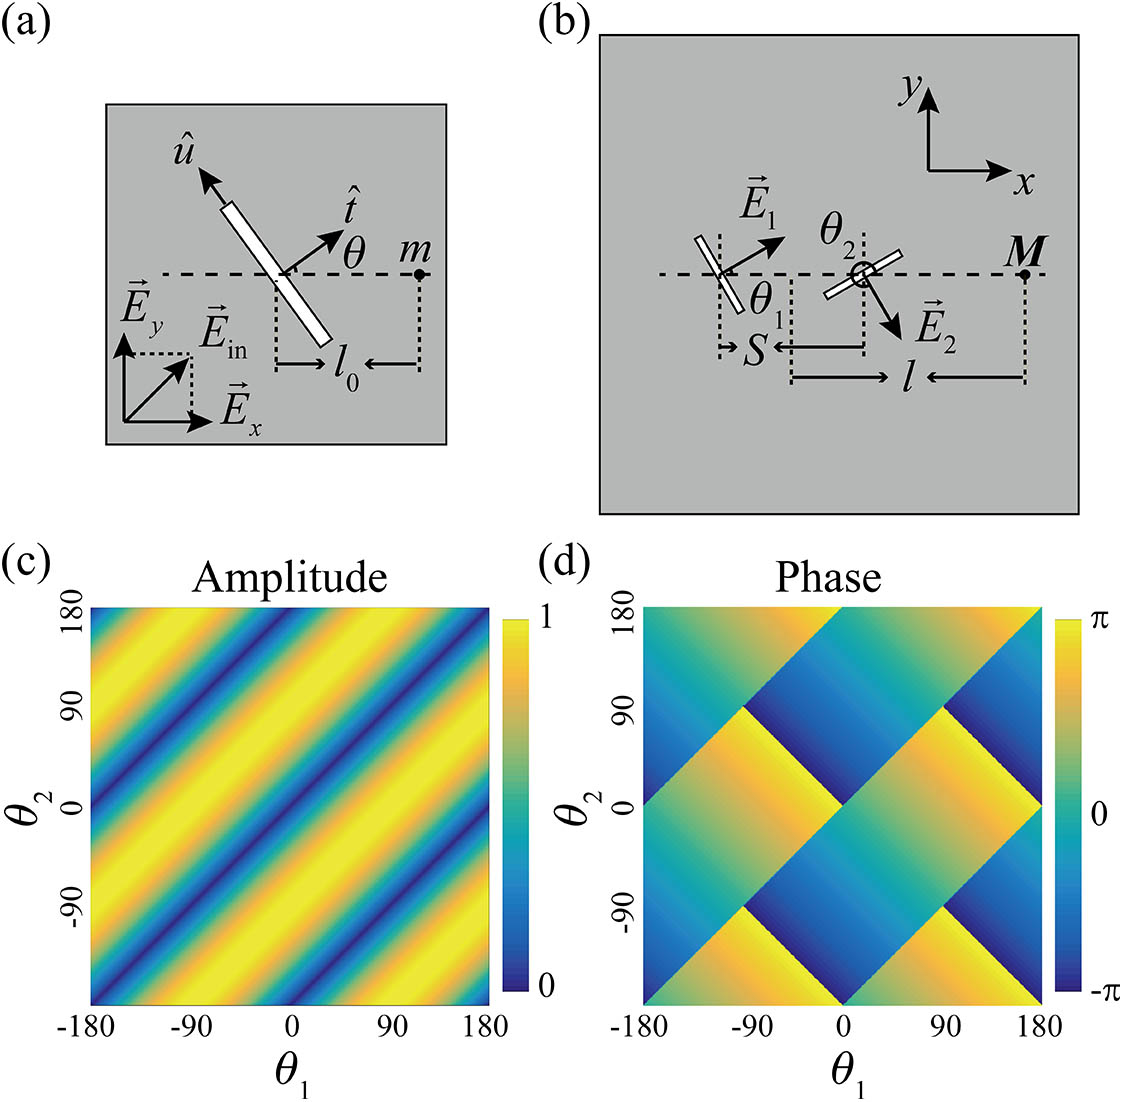
Fig. 1. Schematic view of (a) single slit resonator and (b) a pair of slit resonators. (c) Calculated normalized amplitude and (d) phase distributions of the SWs excited by a pair of slit resonators at various θ 1 θ 2
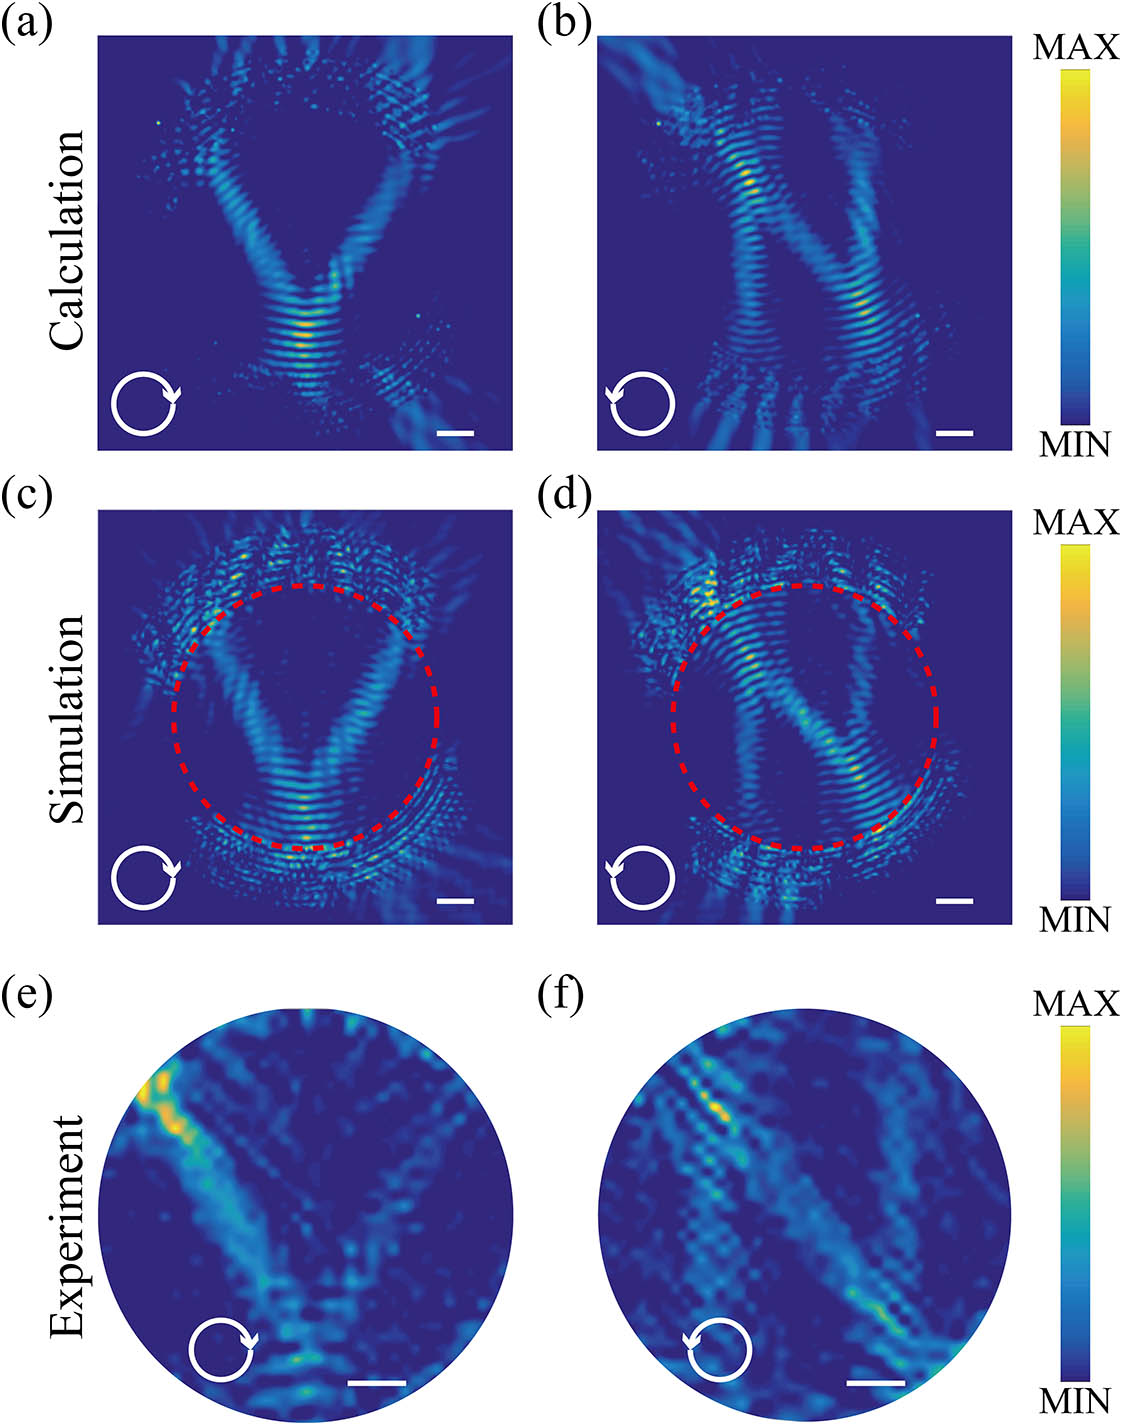
Fig. 2. (a) Calculated, (c) simulated, and (e) measured V-shaped SW intensity profiles (| E z | 2 | E z | 2
Fig. 3. Simulated spectra and SW field distributions (| E z | x
Fig. 4. (a)–(e) Simulated and (f)–(j) measured field intensity distributions (| E z | 2 x
Fig. 5. (a) Schematic and (b) sample image of the SSR pair; scale bar: 25 μm. The subscript and superscript of A x y

Set citation alerts for the article
Please enter your email address
© Copyright 2018-2021 | Chinese Laser Press. All Rights Reserved 沪ICP备15018463号-20