
Tianze Lu, Ning Li, Xiaolong Huang, Chunsheng Weng. Underwater Acoustic Signal Measurement Based on Amplitude-Modulated Laser Interference Technology[J]. Laser & Optoelectronics Progress, 2021, 58(9): 0912006
- Laser & Optoelectronics Progress
- Vol. 58, Issue 9, 0912006 (2021)
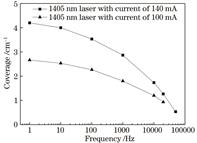
Fig. 1. Curves of wavelength scanning range of DFB laser driven by different currents as function of modulation frequency
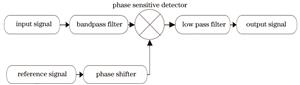
Fig. 2. Demodulation process of amplitude modulated laser interferometer underwater sound
Fig. 3. Time-frequency diagram of interference measurement under silent source condition. (a) Simulation result; (b) spectrum curve
Fig. 4. Time-frequency diagram of interference measurement with sound source of 200 Hz frequency. (a) Simulation result; (b) spectrum curve
Fig. 5. Interference signal spectrum of different methods with sound source of 200 Hz frequency. (a) Traditional laser interferometry method; (b) amplitude modulated laser interferometry method
Fig. 6. Schematic of experimental system
Fig. 7. Measurement results natural fluctuations on surface of calm water. (a) Simulation result; (b) spectrum curve
Fig. 8. Interferometric spectra measured by different methods under different underwater sound source frequencies. (a) Laser interferometry method; (b) amplitude modulated laser interferometry method
Fig. 9. Interferometric spectra obtained by different methods under different sound pressure conditions. (a) Laser interferometry method; (b) amplitude modulated laser interferometry method
Fig. 10. Spectrum diagrams of different light intensity ratios. (a) 10∶1; (b) 1∶1
Fig. 11. Amplitude measurement results of water surface waves under different sound pressure conditions
Fig. 12. Measurement results of different methods under noise interference. (a) Measurement results without optical noise interference; (b) measurement results with optical noise interference
| |||||||||||||||||||||||||||||||||
Table 1. Frequency measurement results of underwater sound sources
| |||||||||||||||||||||||||||||||||||||||||
Table 2. Measurement results of sound field of underwater sound source

Set citation alerts for the article
Please enter your email address
© Copyright 2018-2021 | Chinese Laser Press. All Rights Reserved 沪ICP备15018463号-20