
Yun-Ru Fan, Chen-Zhi Yuan, Rui-Ming Zhang, Si Shen, Peng Wu, He-Qing Wang, Hao Li, Guang-Wei Deng, Hai-Zhi Song, Li-Xing You, Zhen Wang, You Wang, Guang-Can Guo, Qiang Zhou. Effect of dispersion on indistinguishability between single-photon wave-packets[J]. Photonics Research, 2021, 9(6): 1134
- Photonics Research
- Vol. 9, Issue 6, 1134 (2021)
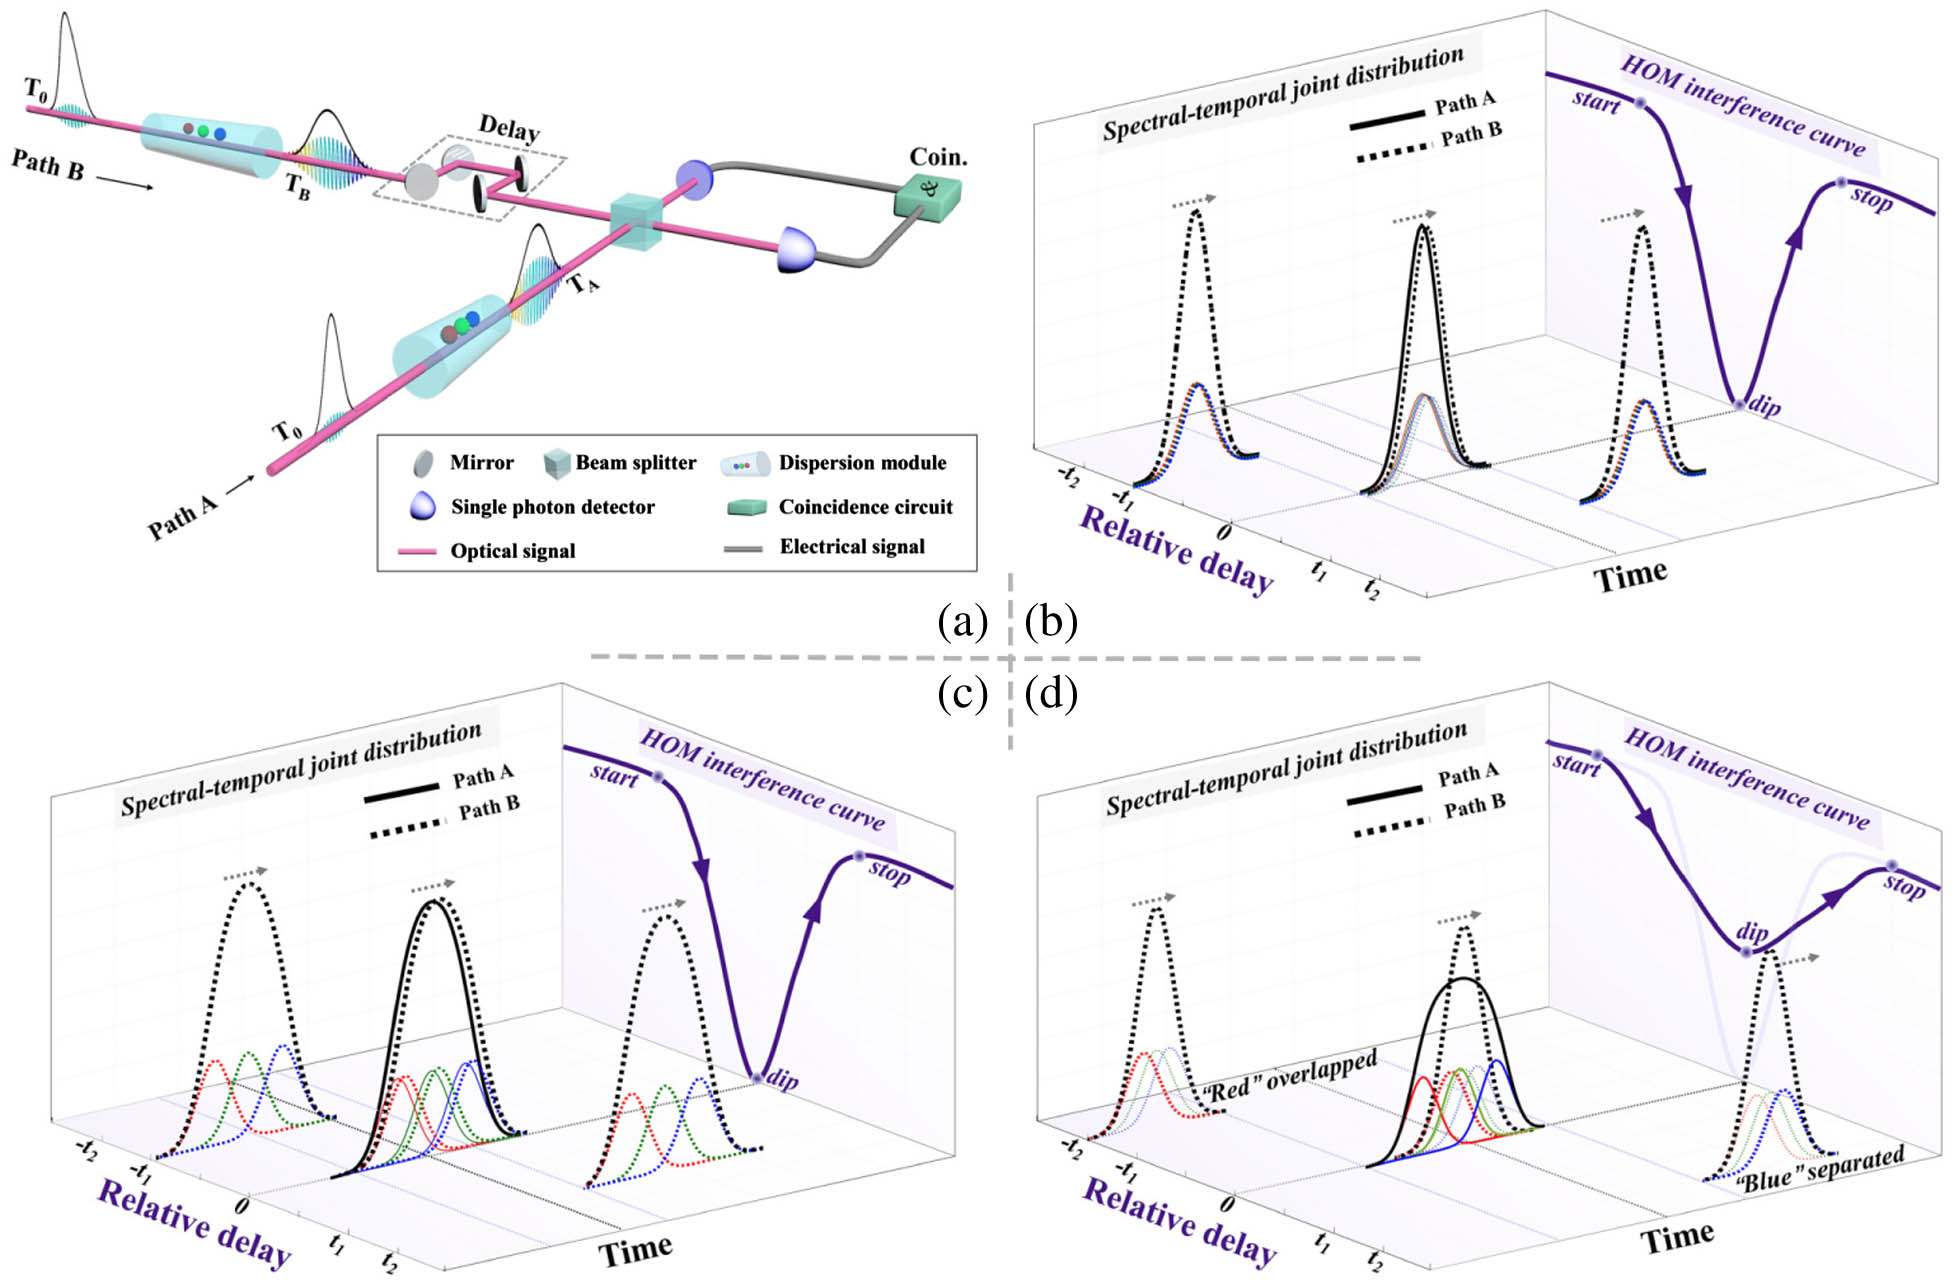
Fig. 1. Conceptual illustration of the HOM interference to reveal the dispersion effect on the indistinguishability between single-photon wave-packets. (a) HOM interferometer with dispersive manipulation modules. Two identical single-photon wave-packets are manipulated with dispersion modules along two optical paths, i.e., path A and path B, and then are sent into an HOM interferometer; (b) HOM interference curves without the second-order dispersion along two paths; (c) with the same second-order dispersion along two paths, i.e., balanced HOM interferometer; (d) with unbalanced second-order dispersions along two paths. To obtain the HOM interference curve, the travel time of the wave-packet in path A is fixed, and that in path B is varied and the time axis is in reference to the center of the pulse in path A. To guide eyes, envelopes of three sub-wave-packets are depicted with solid and dashed lines in red, green, and blue, respectively, and the black envelope covering the three sub-wave-packets is used to illustrate the widths of the wave-packets.
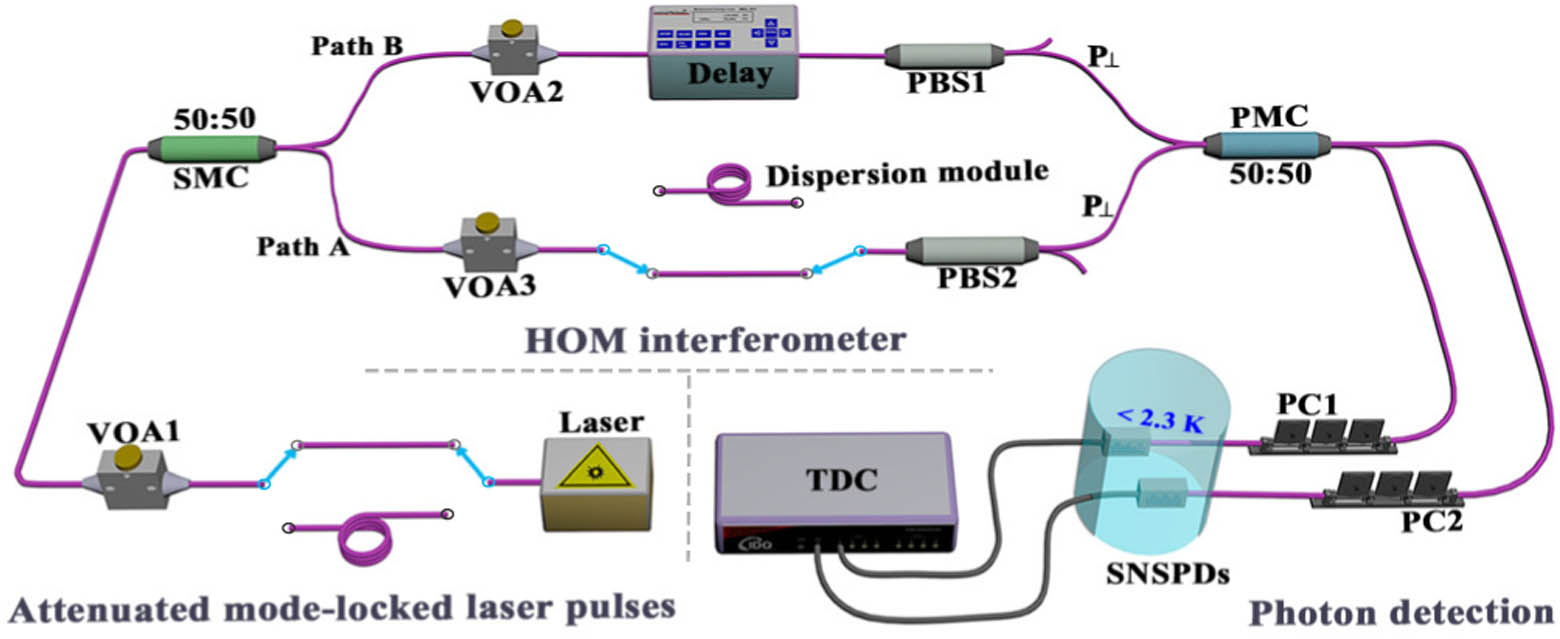
Fig. 2. Experimental setup. The setup consists of attenuated mode-locked laser pulses, HOM interferometer, and photon detection with a dispersion module. VOA, variable optical attenuator; SMC, single-mode fiber coupler; PBS, polarization beam splitter; PMC, polarization-maintaining fiber coupler; PC, polarization controller; SNSPD, superconducting nanowire single photon detector; TDC, time to digital convertor.
Fig. 3. HOM interference curves (a) without a dispersion module, and (b) with 50 km long fiber as the dispersion module at the output of the mode-locked laser, respectively. The blue dots are experimental results. The solid purple lines are Gaussian fitting curves obtained via Monte Carlo method with 1000-time random sampling around each measured data assumed as Poissonian distribution.
Fig. 4. HOM interference curves with a 80 m long single-mode fiber inserted in one path, which corresponds to 16 periods of mode-locked laser pulses.
Fig. 5. (a) Output of a mode-locked pulse laser, measured by a second-order autocorrelator. (b) Output of a mode-locked pulse laser after the dispersive manipulation, recorded by the single-photon detection and a TDC.

Set citation alerts for the article
Please enter your email address
© Copyright 2018-2021 | Chinese Laser Press. All Rights Reserved 沪ICP备15018463号-20