• Spectroscopy and Spectral Analysis
  • Vol. 42, Issue 11, 3595 (2022)
Cheng CHEN1、1;, Xiao-ling LI1、1;, Jin-jie WU2、2;, Xiang-lei CHEN1、1;, Rong-jun WU1、1;, Xiao-hui XU1、1;, and Guo-hua ZHU1、1;
Author Affiliations
  • 11. Wuhan Second Ship Design and Research Institute, Wuhan 430064, China
  • 22. China Academy of Metrology, Beijing 100013, China
  • show less
    DOI: 10.3964/j.issn.1000-0593(2022)11-3595-06 Cite this Article
    Cheng CHEN, Xiao-ling LI, Jin-jie WU, Xiang-lei CHEN, Rong-jun WU, Xiao-hui XU, Guo-hua ZHU. MC Simulation and Energy Spectrum Measurement of K Fluorescence Radiation Field[J]. Spectroscopy and Spectral Analysis, 2022, 42(11): 3595 Copy Citation Text show less
    K fluorescent X-ray radiation device
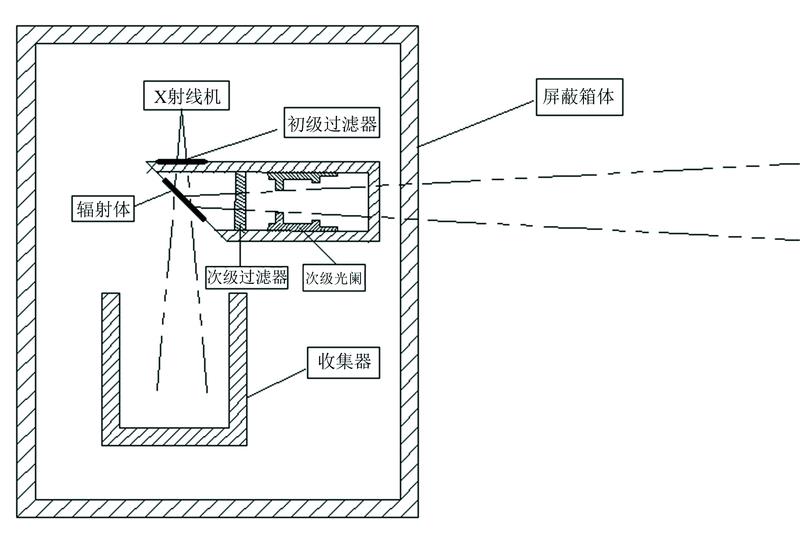
    Fig. 1. K fluorescent X-ray radiation device
    K fluorescence generator MC model
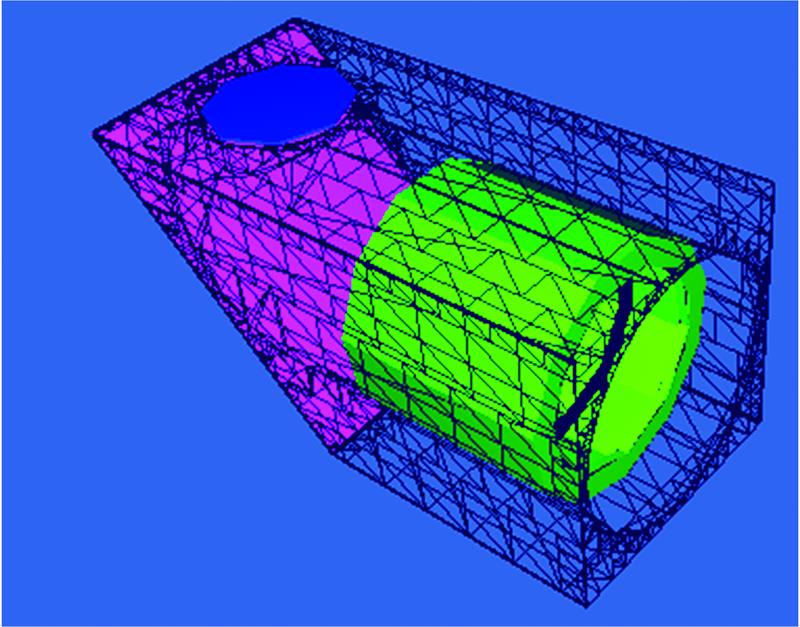
    Fig. 2. K fluorescence generator MC model
    Fluorescence fluence spectrum of Cs2SO4 radiator
    Fig. 3. Fluorescence fluence spectrum of Cs2SO4 radiator
    Kα Fluorescence and total photon intensity versus thicknesss
    Fig. 4. Kα Fluorescence and total photon intensity versus thicknesss
    Schematic diagram of ring detection points distribution
    Fig. 5. Schematic diagram of ring detection points distribution
    Fluorescent device Kα fluorescence intensity distribution
    Fig. 6. Fluorescent device Kα fluorescence intensity distribution
    No fluorescence device Kα fluorescence intensity distribution
    Fig. 7. No fluorescence device Kα fluorescence intensity distribution
    3D view of shielding box MC model
    Fig. 8. 3D view of shielding box MC model
    Mass energy absorption coefficient curve of Te element
    Fig. 9. Mass energy absorption coefficient curve of Te element
    Fluorescence generator with secondary filter MC model
    Fig. 10. Fluorescence generator with secondary filter MC model
    Kα Variation curve of fluorescence purity and fluorescence yield with TeO2 secondary filtration thickness
    Fig. 11. Kα Variation curve of fluorescence purity and fluorescence yield with TeO2 secondary filtration thickness
    Fluorescence spectrum measured by lege detector
    Fig. 12. Fluorescence spectrum measured by lege detector
    Energy spectrum without secondary filter measured by lege
    Fig. 13. Energy spectrum without secondary filter measured by lege
    Energy spectrum with secondary filter measured by lege
    Fig. 14. Energy spectrum with secondary filter measured by lege
    Root double Gaussian fitting Kα1, Kα2energy spectrum
    Fig. 15. Root double Gaussian fitting Kα1, Kα2energy spectrum
    项目数值拟合
    误差
    /%
    理论
    能量值
    实测
    计算
    能量值
    能量
    分辨率
    /%
    Constant7.88×1030.81
    Kα1Mean7.22×1020.00530.62330.682.16
    Sigma5.870.29
    Constant5.42×1031.43
    Kα2Mean7.27×1020.00530.97030.901.15
    Sigma2.771.26
    Table 1. Processing results of double Gaussian fitting energy spectrum
    Cheng CHEN, Xiao-ling LI, Jin-jie WU, Xiang-lei CHEN, Rong-jun WU, Xiao-hui XU, Guo-hua ZHU. MC Simulation and Energy Spectrum Measurement of K Fluorescence Radiation Field[J]. Spectroscopy and Spectral Analysis, 2022, 42(11): 3595
    Download Citation