Author Affiliations
1School of Electronic Information and Artificial Intelligence, Shaanxi University of Science and Technology, Xi'an, Shaanxi 710021, China2Foresight Research Laboratory, Institute of Computing Technology, Chinese Academy of Sciences, Beijing 100080, China3School of Control and Computer Engineering, North China Electric Power University, Beijing 102206, Chinashow less
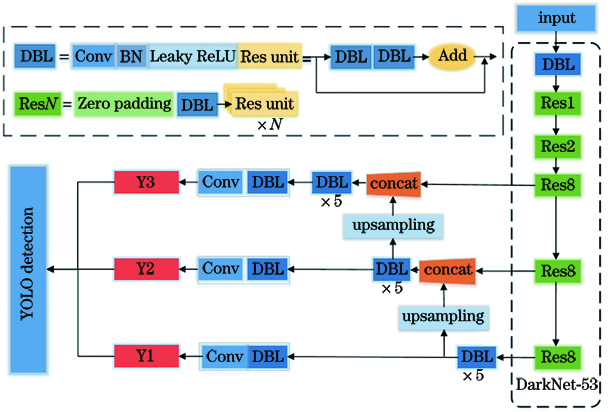
Fig. 1. Overall network structure of YOLOv3
Fig. 2. Overall network structure of AM-YOLOv3
Fig. 3. Structural diagram of attention guidance module
Fig. 4. Schematic diagram of twin-towers structure
Fig. 5. Five types of defects in aluminum profile dataset. (a) Non-conduction; (b) scratch; (c) wrinkle; (d) jet; (e) spot
Fig. 6. Data enhancement results. (a) Original image; (b) enhanced images
Fig. 7. MAP of five types of defects
Fig. 8. mAP curve
Fig. 9. Defects detection effect. (a1)(a2) Non-conduction; (b1)(b2) scratch; (c1)(c2) wrinkle; (d1)(d2) jet; (e1)(e2) spot
Size | Clustering parameter |
---|
13×13 | (392, 33) | (408, 91) | (414, 182) | 26×26 | (224, 163) | (353, 17) | (365, 57) | 52×52 | (87, 90) | (94, 30) | (184, 44) | 104×104 | (9, 12) | (21, 25) | (30, 60) | Precision | 71.14% |
|
Table 1. Clustering results of K-means algorithm
Size | Clustering parameter |
---|
13×13 | (416, 75) | (416, 102) | (416, 190) | 26×26 | (179, 44) | (416, 17) | (416, 39) | 52×52 | (58, 27) | (94, 30) | (113, 28) | 104×104 | (8, 11) | (85, 70) | (25, 46) | Precision | 74.41% |
|
Table 2. Clustering results of K-medians algorithm
Class | Original image | Enhanced image |
---|
Non-conduction | 375 | 2250 | Scratch | 104 | 2080 | Wrinkle | 151 | 2114 | Jet | 66 | 2046 | Spot | 104 | 2080 | Total | 800 | 10570 |
|
Table 3. Comparison of number of defect images before and after expansion
Parameter | Value |
---|
Epoch | 150 | Initial learning rate | 0.0010 | Learning rate when epoch is 50 | 0.0001 | Momentum | 0.9 |
|
Table 4. Partial training parameters after modification
Algorithm | K-medians | Four feature scales | FAG | Twin-towers structure | MmAP /% | fFPS /(frame·s-1) |
---|
YOLOv3 | × | × | × | × | 92.74 | 48.83 | Group A | √ | × | × | × | 93.66 | 56.33 | Group B | √ | √ | × | × | 96.31 | 50.28 | Group C | √ | √ | √ | × | 98.17 | 47.85 | AM-YOLOv3 | √ | √ | √ | √ | 99.05 | 43.94 |
|
Table 5. Comparison of ablation experimental results
Algorithm | Backbone | AP of non-conductiondetection /% | AP of scratchdetection /% | AP of jet detection /% | AP of wrinkle detection /% | AP of spot detection /% | MmAP /% | fFPS /(frame·s-1) |
---|
Faster R-CNN[8] | VGG16 | 87.41 | 74.56 | 79.97 | 96.65 | 22.25 | 72.17 | 17.21 | SSD[9] | VGG16 | 89.79 | 79.88 | 88.96 | 98.92 | 40.62 | 79.63 | 77.17 | YOLOv3[11] | DarkNet-53 | 93.92 | 95.18 | 98.50 | 99.80 | 76.32 | 92.74 | 48.83 | YOLOv3 | ResNet152 | 94.85 | 93.97 | 98.62 | 99.26 | 75.80 | 92.50 | 27.37 | YOLOv4[12] | CSPDarknet53 | 95.21 | 95.79 | 98.99 | 99.76 | 89.96 | 95.94 | 45.29 | YOLOv5[13] | CSPDarknet53 | 96.83 | 97.34 | 99.95 | 99.98 | 93.58 | 97.53 | 42.37 | CenterNet[15] | Resnet-101 | 85.87 | 68.33 | 79.89 | 99.15 | 43.93 | 75.43 | 70.61 | shuzhilian ai[26] | Resnet-101 | 94.48 | 81.80 | 67.73 | 98.30 | 51.12 | 78.69 | 21.43 | AM-YOLOv3 | DarkNet-53 | 98.13 | 98.00 | 100.00 | 99.96 | 99.12 | 99.05 | 43.94 |
|
Table 6. Performance of different algorithms