- Spectroscopy and Spectral Analysis
- Vol. 42, Issue 11, 3501 (2022)
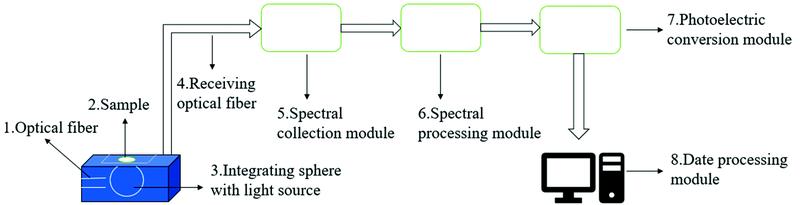
Fig. 1. Near Infrared microplastic measuring system
1: Optical fiber; 2: Sample; 3: Integrating sphere with light source; 4: Receiving optical fiber; 5: Spectral collection module; 6: Spectral processing module; 7: Photoelectric conversion module; 8: Date processing module
1: Optical fiber; 2: Sample; 3: Integrating sphere with light source; 4: Receiving optical fiber; 5: Spectral collection module; 6: Spectral processing module; 7: Photoelectric conversion module; 8: Date processing module
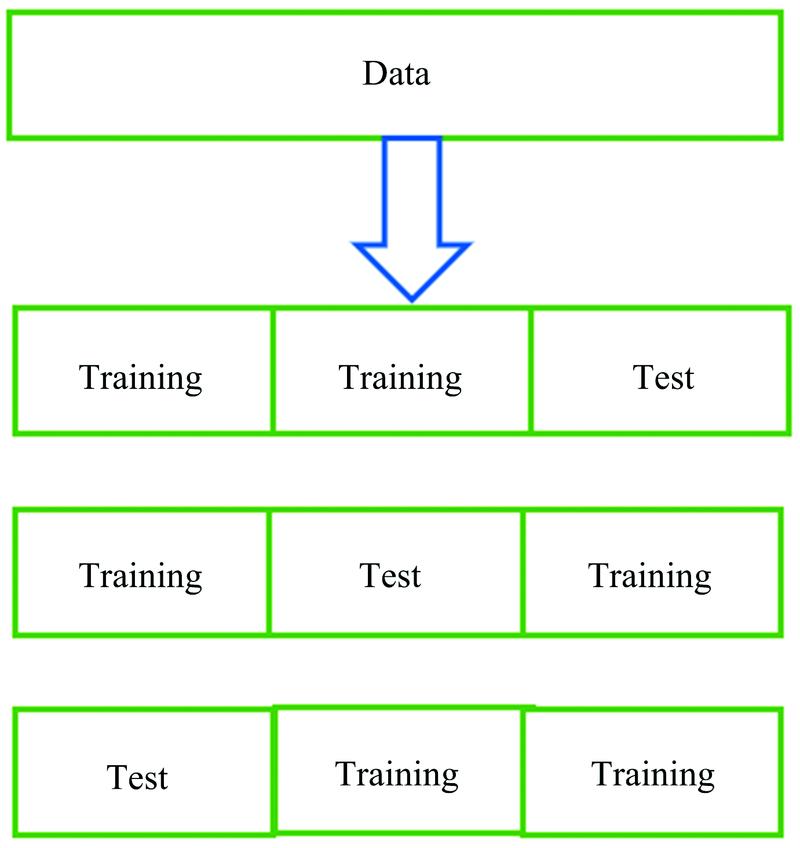
Fig. 2. K-fold cross-validation structure
Fig. 3. XGBoost and SVM for microplastic detection
Fig. 4. Original Near Infrared spectra of microplastics
Fig. 5. The 30 most important spectral variables
Fig. 6. CV average accuracy of n_estimators, learning_rate, max_depth, gamma
Fig. 7. SVM and XGBoost confusion matrixes
Fig. 8. Accuracy score, precision score, recall and F1-score of 10-fold cross validations of XGBoost and SVM
|
Table 1. Comparison of operation results between XGBoost and SVM algorithms

Download Citation

Set citation alerts for the article
Please enter your email address
© Copyright 2018-2021 | Chinese Laser Press. All Rights Reserved 沪ICP备15018463号-20