• Photonics Research
  • Vol. 10, Issue 12, 2708 (2022)
Junjun Shi1、2、4、*, Xiaobo He1、5、*, Yang Li3, and Hongxing Xu2
Author Affiliations
  • 1Shandong Provincial Engineering and Technical Center of Light Manipulations & Shandong Provincial Key Laboratory of Optics and Photonic Device, School of Physics and Electronics, Shandong Normal University, Jinan 250014, China
  • 2School of Physics and Technology, Center for Nanoscience and Nanotechnology, and Key Laboratory of Artificial Micro- and Nano-structures of Ministry of Education, Wuhan University, Wuhan 430072, China
  • 3College of Electronics and Information Engineering, Shenzhen University, Shenzhen 518060, China
  • 4e-mail:
  • 5e-mail:
  • show less
    DOI: 10.1364/PRJ.469534 Cite this Article Set citation alerts
    Junjun Shi, Xiaobo He, Yang Li, Hongxing Xu. Steering of second-harmonic emission by the mode-selective excitation in a hybrid waveguide[J]. Photonics Research, 2022, 10(12): 2708 Copy Citation Text show less
    Beam steering for SHG in a hybrid waveguide through mode-selective excitation. (a) Schematic illustration of SHG from the CdSe nanobelt placed on the top of the Au film, where the edge of the nanobelt is excited by the incident light. (b) The SHG beam steering at the y–z cross-section view when the excitation modes change from TE00 & TE01 (red line) to TE00 & TE02 (orange line). (c) The relationship between the effective refractive index of different modes and the width. (d) Mode profiles of electric field components |Ex| at z along the center of the CdSe nanobelt. The right panel shows the electric field distribution of modes TE00, TE01, and TE02 in the hybrid waveguide. The wavelength of excitation light is 800 nm, the width of the nanobelt is 1.2 μm, and the thickness is 120 nm.
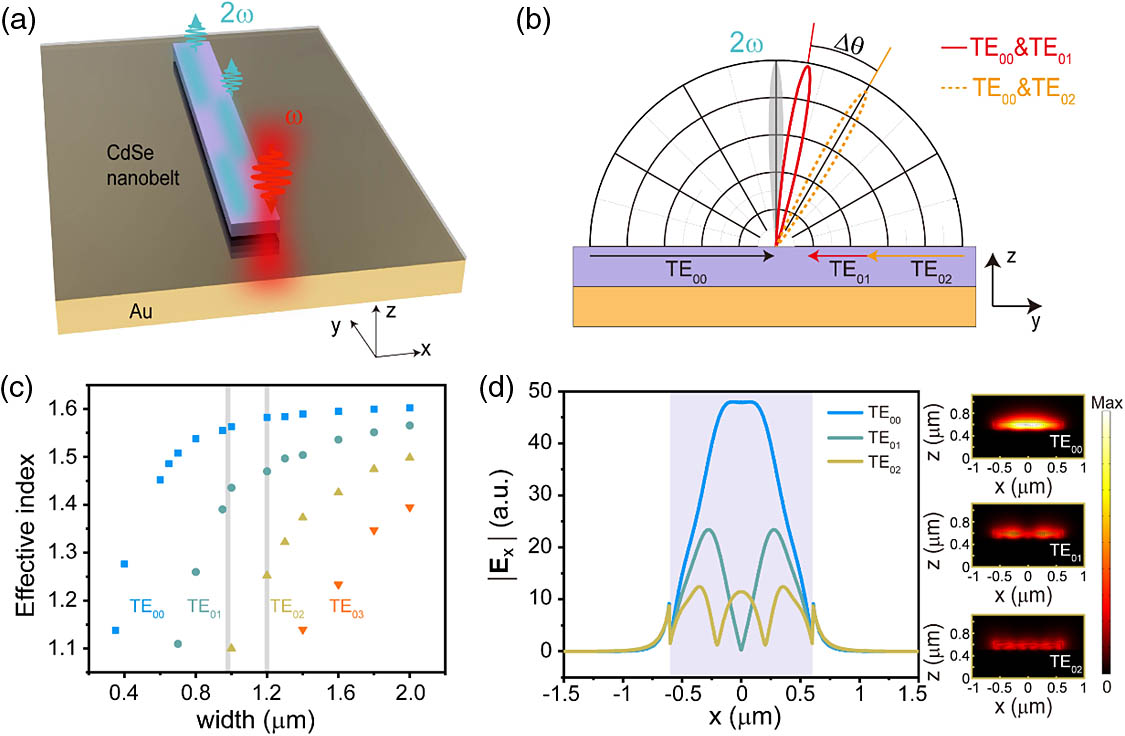
    Fig. 1. Beam steering for SHG in a hybrid waveguide through mode-selective excitation. (a) Schematic illustration of SHG from the CdSe nanobelt placed on the top of the Au film, where the edge of the nanobelt is excited by the incident light. (b) The SHG beam steering at the yz cross-section view when the excitation modes change from TE00 & TE01 (red line) to TE00 & TE02 (orange line). (c) The relationship between the effective refractive index of different modes and the width. (d) Mode profiles of electric field components |Ex| at z along the center of the CdSe nanobelt. The right panel shows the electric field distribution of modes TE00, TE01, and TE02 in the hybrid waveguide. The wavelength of excitation light is 800 nm, the width of the nanobelt is 1.2 μm, and the thickness is 120 nm.
    Nonlinear measurements with different excitation positions. (a) SEM image of a CdSe nanobelt on the Au film, with a length of 13.4 μm, and the width of the lower edge of 0.98 μm and the upper of 1.2 μm. The scale bar in panel (a) also applied in panels (d)–(e). The red arrow shows the polarization of the fundamental light. (b) Spectra of the SHG signal from the red dashed rectangular region in (d). Inset: power dependence of the SHG from the same region. A slope of 2.00 is close to the expected quadratic dependence. (c) Schematic of the supported modes with different excitation positions. (d) SHG intensity images when the excitation spot was at the center of the lower edge, like in Case (1). (e) SHG intensity images when the excitation spot was at the left corner of the upper edge, like in Case (4). (f) The setup of the Fourier imaging system and the coordinate system. (g), (h) Fourier plane images respectively from the (d) green and (e) brown box of the SHG images. The wavelength of the fundamental light is 800 nm.
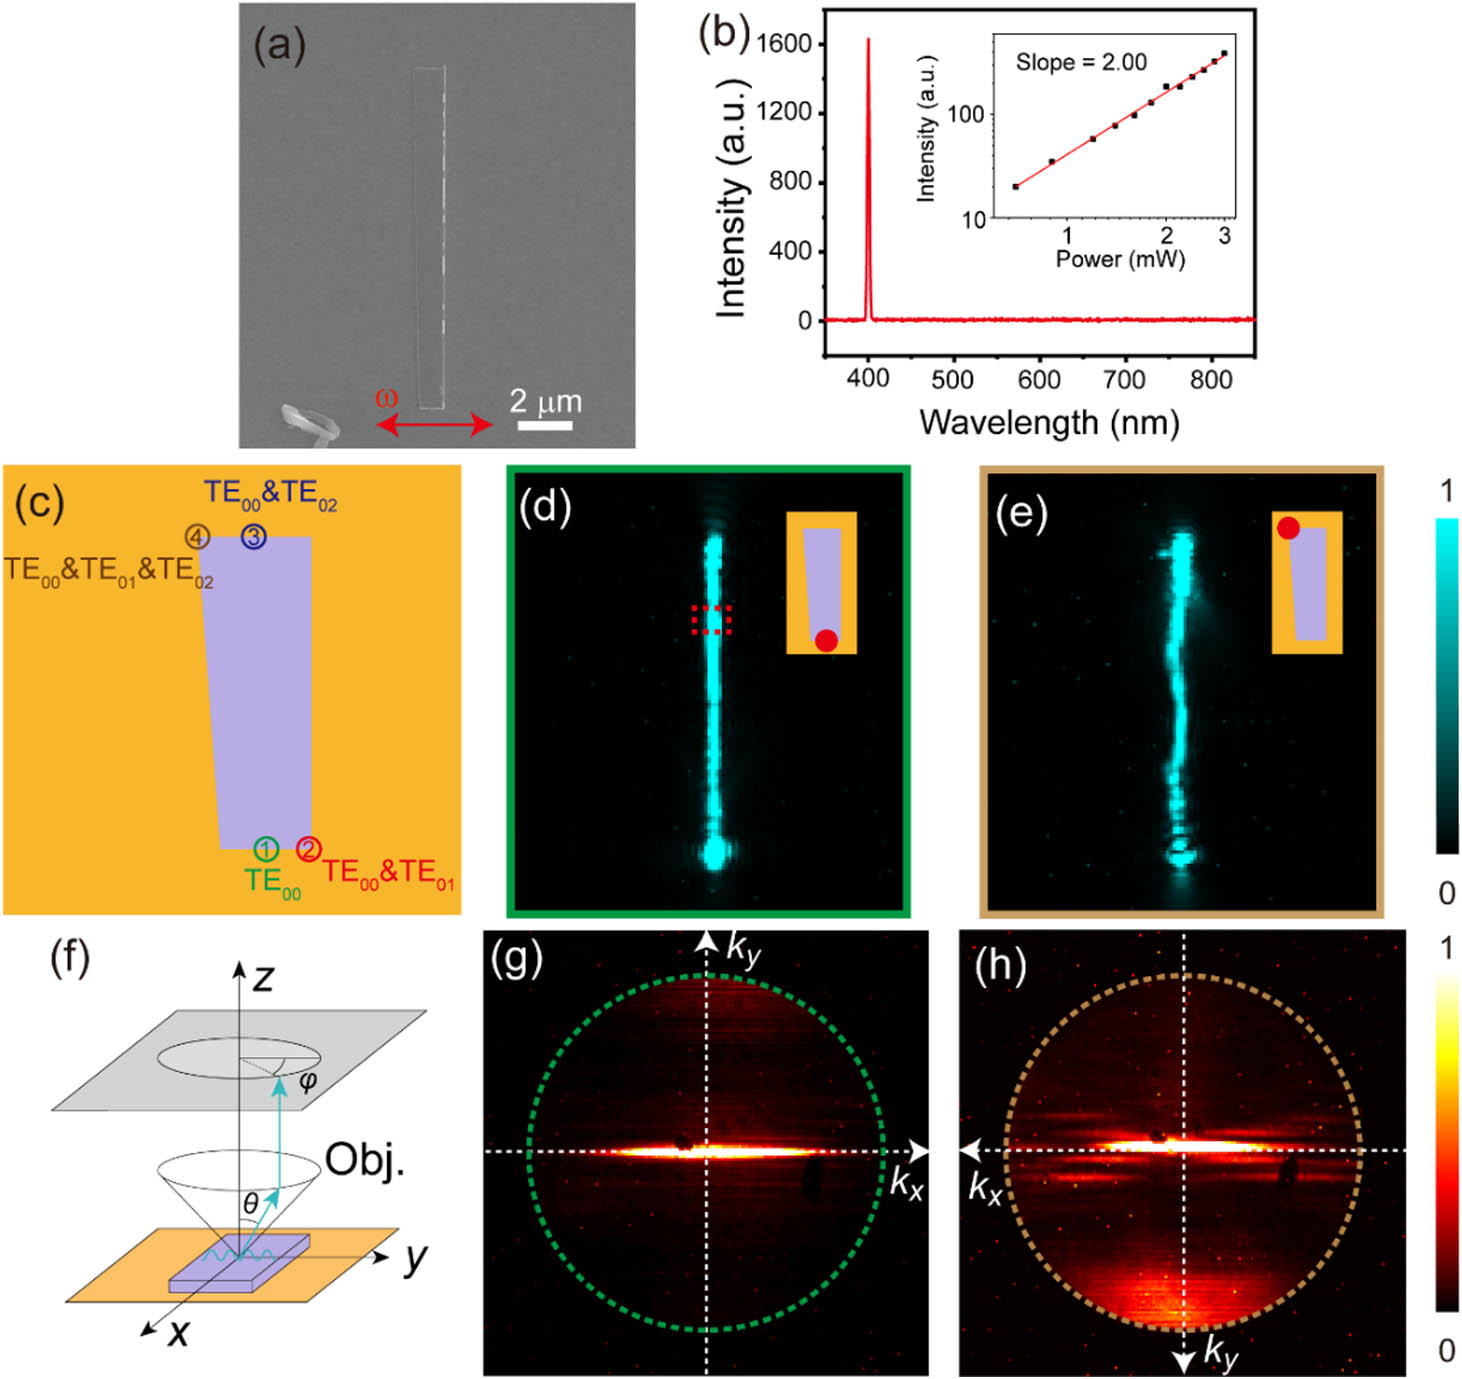
    Fig. 2. Nonlinear measurements with different excitation positions. (a) SEM image of a CdSe nanobelt on the Au film, with a length of 13.4 μm, and the width of the lower edge of 0.98 μm and the upper of 1.2 μm. The scale bar in panel (a) also applied in panels (d)–(e). The red arrow shows the polarization of the fundamental light. (b) Spectra of the SHG signal from the red dashed rectangular region in (d). Inset: power dependence of the SHG from the same region. A slope of 2.00 is close to the expected quadratic dependence. (c) Schematic of the supported modes with different excitation positions. (d) SHG intensity images when the excitation spot was at the center of the lower edge, like in Case (1). (e) SHG intensity images when the excitation spot was at the left corner of the upper edge, like in Case (4). (f) The setup of the Fourier imaging system and the coordinate system. (g), (h) Fourier plane images respectively from the (d) green and (e) brown box of the SHG images. The wavelength of the fundamental light is 800 nm.
    (a)–(c) SHG intensity images when the excitation spot was at the (a) right corner and (c) left corner of the lower edge, and (b) at the center of the upper edge. The inset shows the schematic of the excitation positions in the experiment. (d)–(f) Fourier plane images respectively from the (a) orange, (b) blue, and (c) orange box of the SHG images. The emission angles are θR=θL=3.3° and θC=9.4°.
    Fig. 3. (a)–(c) SHG intensity images when the excitation spot was at the (a) right corner and (c) left corner of the lower edge, and (b) at the center of the upper edge. The inset shows the schematic of the excitation positions in the experiment. (d)–(f) Fourier plane images respectively from the (a) orange, (b) blue, and (c) orange box of the SHG images. The emission angles are θR=θL=3.3° and θC=9.4°.
    Steering characters of SHG from the mode-selective excitation. Calculated z-component of the power flux at SH frequency when launching (a) TE00 & TE02 modes or (c) TE00 & TE01 modes into the tapered waveguide with a length of 13.4 μm. The distribution of the SH pattern relies on the types of the launched modes. The Fourier images of the SH photons with TE00 & TE02 modes in (b) and TE00 & TE01 modes in (d). The outer dashed circle of the Fourier image indicates the collection angle of the objective corresponds to 60°. (e) Measured emission angles of SHG are a function of the fundamental wavelength. θR represents the excitation situation of the fundamental light on the corner of the narrow edge, and θC represents the excitation situation of the fundamental light on the center of the wide edge of the nanobelt. The solid line is the simulated results, and the solid dots are the experiment results.
    Fig. 4. Steering characters of SHG from the mode-selective excitation. Calculated z-component of the power flux at SH frequency when launching (a) TE00 & TE02 modes or (c) TE00 & TE01 modes into the tapered waveguide with a length of 13.4 μm. The distribution of the SH pattern relies on the types of the launched modes. The Fourier images of the SH photons with TE00 & TE02 modes in (b) and TE00 & TE01 modes in (d). The outer dashed circle of the Fourier image indicates the collection angle of the objective corresponds to 60°. (e) Measured emission angles of SHG are a function of the fundamental wavelength. θR represents the excitation situation of the fundamental light on the corner of the narrow edge, and θC represents the excitation situation of the fundamental light on the center of the wide edge of the nanobelt. The solid line is the simulated results, and the solid dots are the experiment results.
    (a) TEM micrograph of a CdSe nanobelt. (b) Electron diffraction pattern of the CdSe nanobelt.
    Fig. 5. (a) TEM micrograph of a CdSe nanobelt. (b) Electron diffraction pattern of the CdSe nanobelt.
    Schematic setup for the SHG measurement.
    Fig. 6. Schematic setup for the SHG measurement.
    Light propagation in the designed taper when the input is (a) the TE00 modal field and (b) the TE01 modal field from the left side. (c)–(e) The input is (c) the TE00 modal field, (d) the TE01 modal field, and (e) the TE02 model field from the right side.
    Fig. 7. Light propagation in the designed taper when the input is (a) the TE00 modal field and (b) the TE01 modal field from the left side. (c)–(e) The input is (c) the TE00 modal field, (d) the TE01 modal field, and (e) the TE02 model field from the right side.
    (a) Fault color images of SHG image, where the excitation laser at 800 nm was parallel excitation. (b) The corresponding SHG Fourier image.
    Fig. 8. (a) Fault color images of SHG image, where the excitation laser at 800 nm was parallel excitation. (b) The corresponding SHG Fourier image.
    (a) Schematic illustration of a chain of SH dipoles. (b) Electric field distribution at the x–y cross section. (c), (d) Fourier imaging from different collection areas: (c) white and (d) orange boxes in panel (b).
    Fig. 9. (a) Schematic illustration of a chain of SH dipoles. (b) Electric field distribution at the xy cross section. (c), (d) Fourier imaging from different collection areas: (c) white and (d) orange boxes in panel (b).
    (a) Fourier image when the excitation spot was at the center of the upper edge in our waveguide. (b) Intensity distribution versus θ along the orange line in panel (a).
    Fig. 10. (a) Fourier image when the excitation spot was at the center of the upper edge in our waveguide. (b) Intensity distribution versus θ along the orange line in panel (a).
    Junjun Shi, Xiaobo He, Yang Li, Hongxing Xu. Steering of second-harmonic emission by the mode-selective excitation in a hybrid waveguide[J]. Photonics Research, 2022, 10(12): 2708
    Download Citation