
Yi Xu, Fu Li, Jianqiang Gu, Zhiwei Bi, Bing Cao, Quanlong Yang, Jiaguang Han, Qinghua Hu, Weili Zhang. Spectral transfer-learning-based metasurface design assisted by complex-valued deep neural network[J]. Advanced Photonics Nexus, 2024, 3(2): 026002
- Advanced Photonics Nexus
- Vol. 3, Issue 2, 026002 (2024)
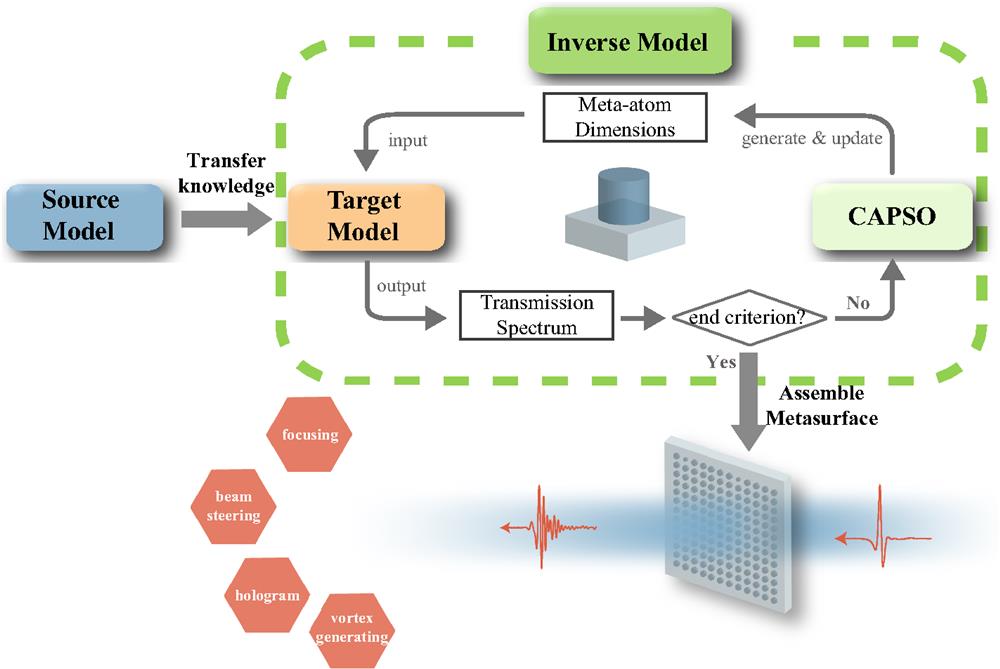
Fig. 1. Flowchart of the spectral transfer-learning-based metasurface comprehensive design methodology assisted by the complex-valued DNN.
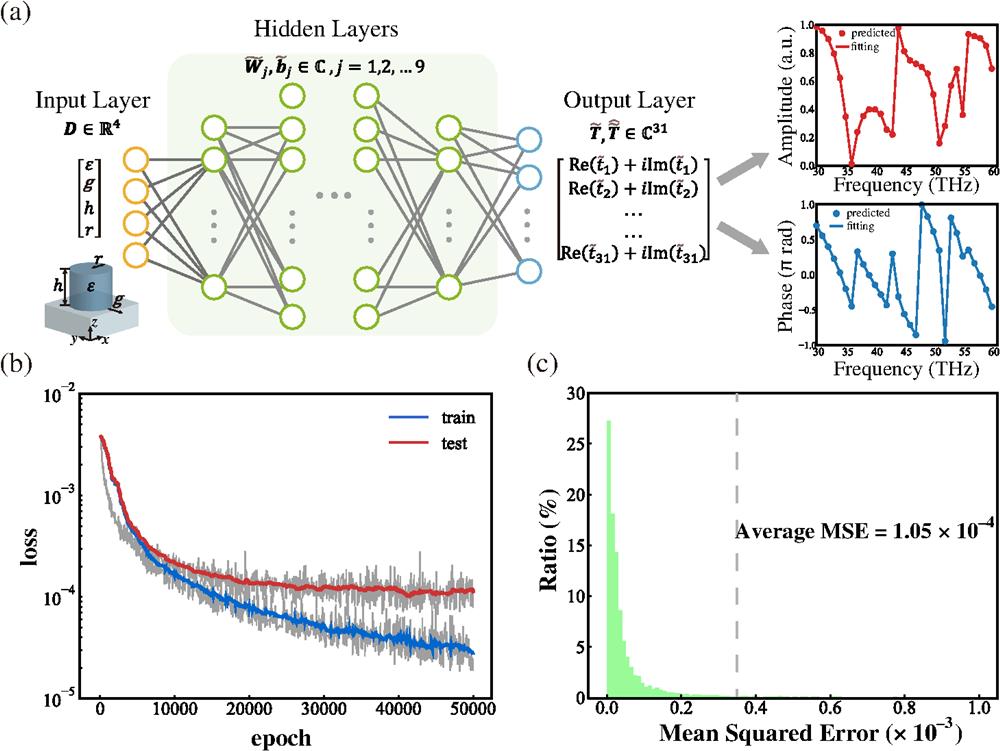
Fig. 2. Schematic of the source model. (a) Illustration for the architecture and the parameters of the CDNN. (b) Learning curves of the CDNN that take the loss value as the function of the epoch. The smoothed train loss (blue curve) and test loss (red curve) are shown in the original learning curves (light gray). (c) Histogram of the MSE for the predicted complex transmission from the test set, where 95% of the data have an
Fig. 3. Schematic of transfer learning. (a) Diagram of the relation of interest bands of the source and target task and (b) illustration of spectral transfer learning. The top row is the architecture of the source model (blue), and the next rows are the target models (orange) based on three transfer strategies: frozen-none, copy-all, and hybrid-transfer, respectively. Blue blocks represent the copied layers from the trained source network and then are fine-tuned during training. Orange blocks represent the fine-tuned layers with random initialization. The mosaic pattern represents the frozen state. Black rounded rectangles represent activation layers.
Fig. 4. Results of the spectral transfer learning. (a) Clusters of learning curves of three transfer strategies: frozen-none (red), copy-all (blue), and hybrid-transfer (orange). The colors from dark to light indicate the number of transfer layers from less to more. (b) Examples demonstrating the performance of the target CDNN using transfer learning.
Fig. 5. Characterization of the metalens designed by the hybrid inverse model. (a), (b) The target phase and amplitude profiles (blue lines) and the phases and amplitudes of the optimized meta-atoms at each pixel selected by our inverse model (red hollow circles). (c), (d) The theoretical and simulated normalized intensity distributions of the designed metalens along the propagation plane.
Fig. 6. Characterization of the metavortex generator designed by the hybrid inverse model. (a) The structure pattern, phase, and amplitude distributions of the designed metavortex generator output from the hybrid inverse model. (b), (c) The theoretical and simulated results for the phase, real part, and normalized intensity distributions along the

Set citation alerts for the article
Please enter your email address
© Copyright 2018-2021 | Chinese Laser Press. All Rights Reserved 沪ICP备15018463号-20