• Photonics Research
  • Vol. 9, Issue 7, 1280 (2021)
Yao Duan, Xingwang Zhang, Yimin Ding, and Xingjie Ni*
Author Affiliations
  • Department of Electrical Engineering, The Pennsylvania State University, University Park, Pennsylvania 16802, USA
  • show less
    DOI: 10.1364/PRJ.417296 Cite this Article Set citation alerts
    Yao Duan, Xingwang Zhang, Yimin Ding, Xingjie Ni. Single-cavity bi-color laser enabled by optical anti-parity-time symmetry[J]. Photonics Research, 2021, 9(7): 1280 Copy Citation Text show less
    Schematic illustration of (a) PT and (b) APT symmetries in a two-oscillator system. −ig (ig) and κ represent gain (loss) and coupling coefficients, respectively. In the PT symmetric system, resonance frequencies ω1, ω2 of the two oscillators are identical, while they are different in the APT symmetric one. (c) Configuration of APT symmetric micro-ring resonator under spatiotemporal modulation for bi-color lasing. The dynamic imaginary grating of permittivity with alternating gain (G) and loss (L) is moving azimuthally along the ring. The moving direction is indicated by the green arrow.
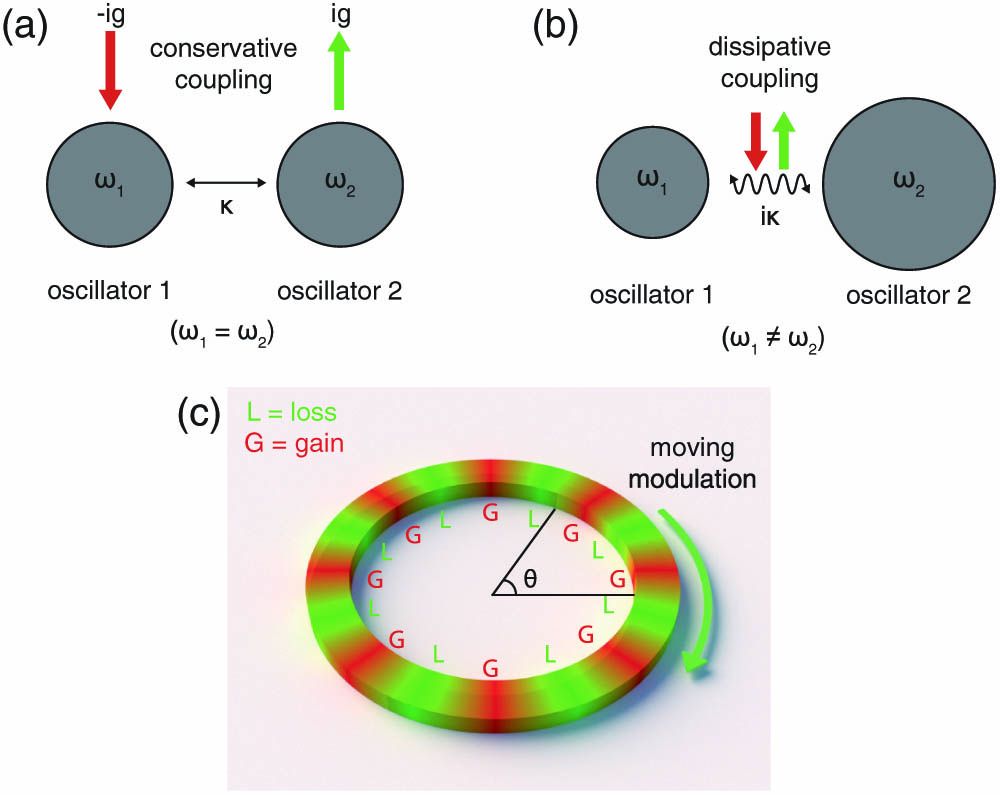
    Fig. 1. Schematic illustration of (a) PT and (b) APT symmetries in a two-oscillator system. ig (ig) and κ represent gain (loss) and coupling coefficients, respectively. In the PT symmetric system, resonance frequencies ω1, ω2 of the two oscillators are identical, while they are different in the APT symmetric one. (c) Configuration of APT symmetric micro-ring resonator under spatiotemporal modulation for bi-color lasing. The dynamic imaginary grating of permittivity with alternating gain (G) and loss (L) is moving azimuthally along the ring. The moving direction is indicated by the green arrow.
    (a) Real and (b) imaginary parts of normalized eigenfrequency spectra with respect to modulation frequency ωm and coupling coefficient κm. The black dashed lines are the exceptional lines, where the two eigenstates degenerate. (c) Real (solid lines) and imaginary parts (dashed lines) of eigenfrequencies under a fixed κm indicated by the gray planes in (a) and (b), respectively. The yellow and red regions indicate broken APT and unbroken APT phases, respectively. (d) Real and (e) imaginary parts of the eigenfrequencies versus κm with different ωm (indicated by different colors). The red circles in (d) indicate the uncoupled cases (κm=0), and there are no sidebands. The red and blue curves are the modes in a PT symmetric case as reported in Ref. [15] for reference.
    Fig. 2. (a) Real and (b) imaginary parts of normalized eigenfrequency spectra with respect to modulation frequency ωm and coupling coefficient κm. The black dashed lines are the exceptional lines, where the two eigenstates degenerate. (c) Real (solid lines) and imaginary parts (dashed lines) of eigenfrequencies under a fixed κm indicated by the gray planes in (a) and (b), respectively. The yellow and red regions indicate broken APT and unbroken APT phases, respectively. (d) Real and (e) imaginary parts of the eigenfrequencies versus κm with different ωm (indicated by different colors). The red circles in (d) indicate the uncoupled cases (κm=0), and there are no sidebands. The red and blue curves are the modes in a PT symmetric case as reported in Ref. [15] for reference.
    (a) Normalized reflection spectra T11 and lasing spectra T1, (b) normalized transmission spectra T21 and lasing spectra T2 under different modulation depths ΔϵI with a fixed modulation frequency ωm=1 THz (see Fig. 6 in Appendix B for T31 and T41). The definitions of the ports, T11, T21, T1, and T2 are depicted in the insets. The yellow and red regimes indicate the broken and unbroken APT phases, respectively. (c) Real parts of the resonance frequencies and (d) imaginary parts of resonance wave vectors extracted from full-wave simulations (circles) and theoretical calculations based on the APT symmetry (dashed lines). The colors of the dashed curves in (c) and (d) correspond to the lines of the same color in (a) and (b).
    Fig. 3. (a) Normalized reflection spectra T11 and lasing spectra T1, (b) normalized transmission spectra T21 and lasing spectra T2 under different modulation depths ΔϵI with a fixed modulation frequency ωm=1  THz (see Fig. 6 in Appendix B for T31 and T41). The definitions of the ports, T11, T21, T1, and T2 are depicted in the insets. The yellow and red regimes indicate the broken and unbroken APT phases, respectively. (c) Real parts of the resonance frequencies and (d) imaginary parts of resonance wave vectors extracted from full-wave simulations (circles) and theoretical calculations based on the APT symmetry (dashed lines). The colors of the dashed curves in (c) and (d) correspond to the lines of the same color in (a) and (b).
    Normalized intensity distribution of the micro-ring system at (a) λ=1.552 μm and (b) λ=1.560 μm with ΔϵI=0.508 and ωm=1 THz. The white lines outline the geometry of the micro-ring as well as the coupling waveguides. The white arrows indicate the traveling direction of spatiotemporal modulation, and the yellow arrows show the output lasing direction. The ports are numbered in the same way as those shown in Fig. 3. (c) Real parts of resonance frequencies extracted from full-wave simulations (circles) and the calculated ones based on our APT theory (dashed lines) with a fixed ΔϵI=0.315 while varying ωm. The red regime indicates the unbroken APT phase. (d) Lasing spectra from all ports with the same modulation depth as in (a) and (b). l is the azimuthal order of the WGM.
    Fig. 4. Normalized intensity distribution of the micro-ring system at (a) λ=1.552  μm and (b) λ=1.560  μm with ΔϵI=0.508 and ωm=1  THz. The white lines outline the geometry of the micro-ring as well as the coupling waveguides. The white arrows indicate the traveling direction of spatiotemporal modulation, and the yellow arrows show the output lasing direction. The ports are numbered in the same way as those shown in Fig. 3. (c) Real parts of resonance frequencies extracted from full-wave simulations (circles) and the calculated ones based on our APT theory (dashed lines) with a fixed ΔϵI=0.315 while varying ωm. The red regime indicates the unbroken APT phase. (d) Lasing spectra from all ports with the same modulation depth as in (a) and (b). l is the azimuthal order of the WGM.
    Real and imaginary parts of Δϵm around 1.55 μm under ω0m=1.215×10¹⁵ s−1 and Γm=3.5×10¹⁵ s−1. The imaginary part is around 100 times larger than the real part.
    Fig. 5. Real and imaginary parts of Δϵm around 1.55 μm under ω0m=1.215×10¹⁵  s1 and Γm=3.5×10¹⁵  s1. The imaginary part is around 100 times larger than the real part.
    (a) Numerical normalized transmission spectra T31, lasing spectra T3, (b) transmission spectra T41, and lasing spectra T4 under different modulation depths ΔϵI and ωm=1 THz. The definitions of T31, T41, T3, and T4 are depicted in the inset. The yellow and red shaded areas indicate different APT phases.
    Fig. 6. (a) Numerical normalized transmission spectra T31, lasing spectra T3, (b) transmission spectra T41, and lasing spectra T4 under different modulation depths ΔϵI and ωm=1  THz. The definitions of T31, T41, T3, and T4 are depicted in the inset. The yellow and red shaded areas indicate different APT phases.
    Simulated transmission spectra from T11 to T41 and lasing spectra from T1 to T4 under increasing modulation frequency. Modulation depth Δϵ=0.315. The circles mark the spectral position of the resonances. The red regime indicates unbroken APT phase.
    Fig. 7. Simulated transmission spectra from T11 to T41 and lasing spectra from T1 to T4 under increasing modulation frequency. Modulation depth Δϵ=0.315. The circles mark the spectral position of the resonances. The red regime indicates unbroken APT phase.
    Transmission spectra T21 and T12 around resonance |±18⟩ in broken APT phase. The micro-ring diameter is smaller than the one in the main text. The crosses are simulation results under three different Δϵ, and the curves are theoretical calculation from Eqs. (E5) and (E6). Here Δϵth is the modulation depth at EP.
    Fig. 8. Transmission spectra T21 and T12 around resonance |±18 in broken APT phase. The micro-ring diameter is smaller than the one in the main text. The crosses are simulation results under three different Δϵ, and the curves are theoretical calculation from Eqs. (E5) and (E6). Here Δϵth is the modulation depth at EP.
    Intensity distribution at different times in (a)–(c) broken APT phase and (d)–(f) unbroken APT phase for |±17⟩. The modulation propagates counterclockwise with frequency of ωm=1 THz. (a), (d) Intensity profile at t=t0; (b), (e) at t=t0+tm/3; (c), (f) at t=t0+2tm/3. Here t0, tm are reference time and the period of spatiotemporal modulation (tm=1/ωm), respectively. Insets show zoom-in view of the interference patterns and modulation profile in the blue dashed box. The red and yellow arrows indicate the traveling directions of both modulation and intensity profiles, respectively. The black arrow and black dashed lines mark the full width at half maximum of the intensity profile.
    Fig. 9. Intensity distribution at different times in (a)–(c) broken APT phase and (d)–(f) unbroken APT phase for |±17. The modulation propagates counterclockwise with frequency of ωm=1  THz. (a), (d) Intensity profile at t=t0; (b), (e) at t=t0+tm/3; (c), (f) at t=t0+2tm/3. Here t0, tm are reference time and the period of spatiotemporal modulation (tm=1/ωm), respectively. Insets show zoom-in view of the interference patterns and modulation profile in the blue dashed box. The red and yellow arrows indicate the traveling directions of both modulation and intensity profiles, respectively. The black arrow and black dashed lines mark the full width at half maximum of the intensity profile.
    Yao Duan, Xingwang Zhang, Yimin Ding, Xingjie Ni. Single-cavity bi-color laser enabled by optical anti-parity-time symmetry[J]. Photonics Research, 2021, 9(7): 1280
    Download Citation