• Photonics Research
  • Vol. 5, Issue 3, 143 (2017)
Yang Yu1, Ting-Hui Xiao1, Hong-Lian Guo2, and Zhi-Yuan Li1、2、*
Author Affiliations
  • 1Laboratory of Optical Physics, Institute of Physics, Chinese Academy of Sciences, P.O. Box 603, Beijing 100190, China
  • 2School of Physics, South China University of Technology, Guangzhou 510640, China
  • show less
    DOI: 10.1364/PRJ.5.000143 Cite this Article Set citation alerts
    Yang Yu, Ting-Hui Xiao, Hong-Lian Guo, Zhi-Yuan Li. Sensing of microparticles based on a broadband ultrasmall microcavity in a freely suspended microfiber[J]. Photonics Research, 2017, 5(3): 143 Copy Citation Text show less
    (a) Dispersion relationship of a periodic stack with alternating quarter-wavelength SiO2 slabs and air. The orange curve refers to the relationship between the frequency and the imaginary part of the dimensionless wave vector. It can be observed that the imaginary part of the dimensionless wave vector reaches its maximum at the center of the bandgap. The inset figure is the schematic diagram of the stack, and the shadow region is its bandgap range. (b) The upper panel is the schematic diagram of our proposed reflector, which is composed of a set of eleven through holes with length T, width t, and period Λ, respectively equal to 1.2, 0.3, and 0.66 μm. The diameter of the microfiber is 1.7 μm. The lower panel is the distribution of electric field magnitude of the proposed reflector at an incident wavelength of 1.55 μm. The red arrows indicate the position and incident direction of the optical source. (c) Transmission and reflection spectra of the proposed reflector, (d) variation of the electric field magnitude along the z axis at the center of the microfiber in the lower panel of (b).
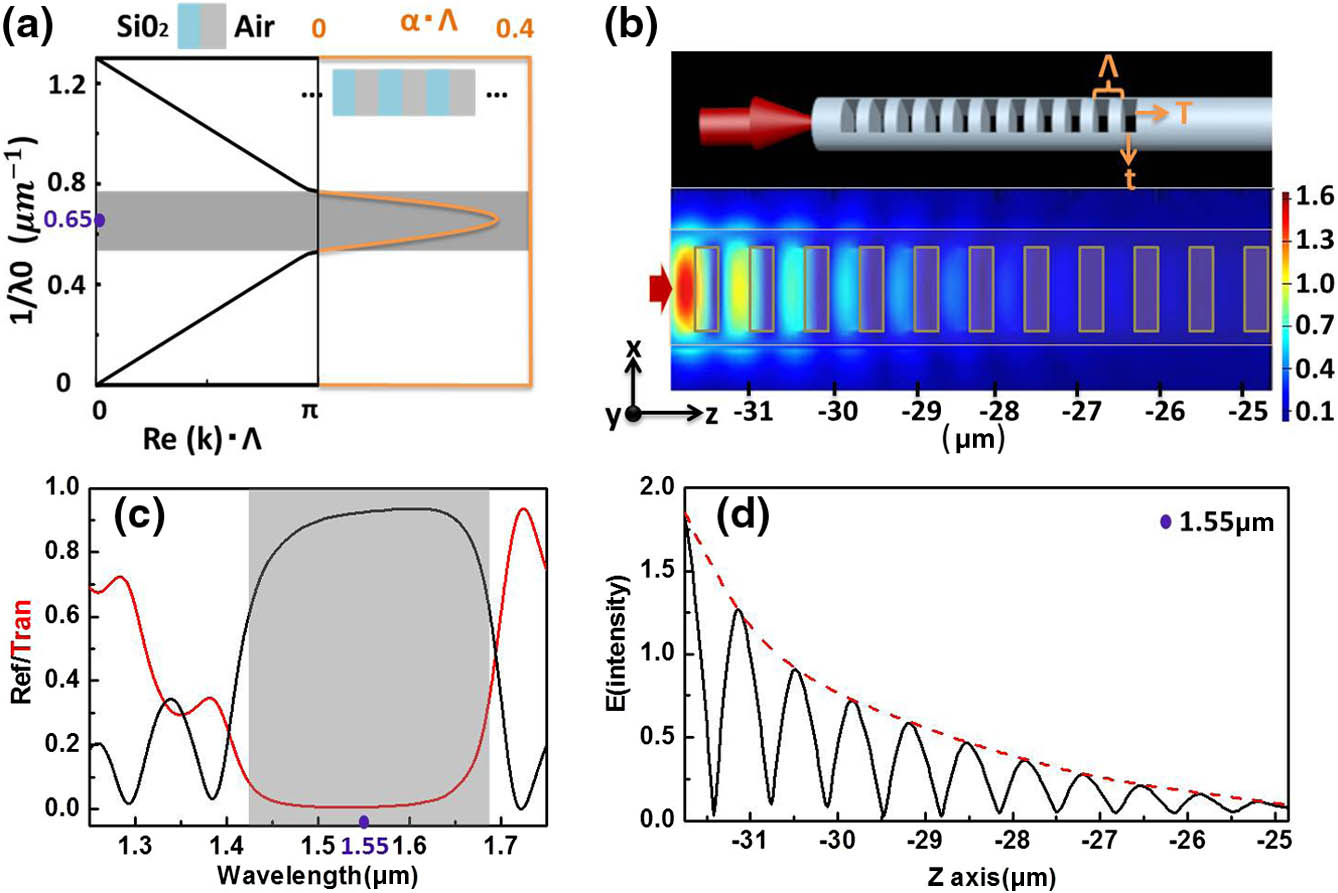
    Fig. 1. (a) Dispersion relationship of a periodic stack with alternating quarter-wavelength SiO2 slabs and air. The orange curve refers to the relationship between the frequency and the imaginary part of the dimensionless wave vector. It can be observed that the imaginary part of the dimensionless wave vector reaches its maximum at the center of the bandgap. The inset figure is the schematic diagram of the stack, and the shadow region is its bandgap range. (b) The upper panel is the schematic diagram of our proposed reflector, which is composed of a set of eleven through holes with length T, width t, and period Λ, respectively equal to 1.2, 0.3, and 0.66 μm. The diameter of the microfiber is 1.7 μm. The lower panel is the distribution of electric field magnitude of the proposed reflector at an incident wavelength of 1.55 μm. The red arrows indicate the position and incident direction of the optical source. (c) Transmission and reflection spectra of the proposed reflector, (d) variation of the electric field magnitude along the z axis at the center of the microfiber in the lower panel of (b).
    (a) SEM of the fabricated microcavity. Reflection and transmission spectra of the microcavity whose cavity length is 50 μm, acquired by (b) FDTD simulation and (c) experimental measurement.
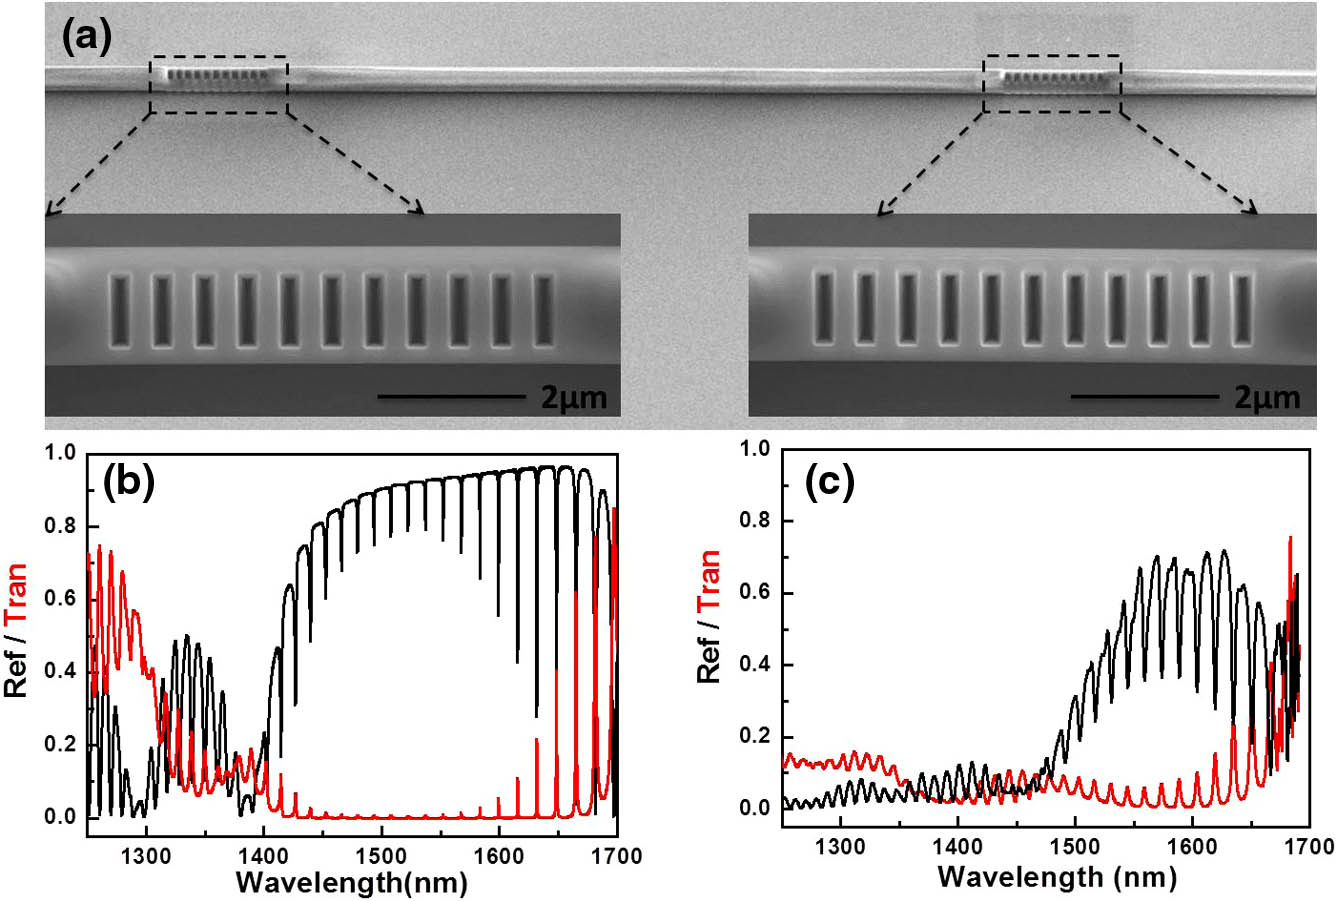
    Fig. 2. (a) SEM of the fabricated microcavity. Reflection and transmission spectra of the microcavity whose cavity length is 50 μm, acquired by (b) FDTD simulation and (c) experimental measurement.
    SEM images of FIB-fabricated ultrasmall microcavities with cavity lengths of (a) 0.92 μm and (b) 1.22 μm. (c), (d) Transmission and reflection spectra of the microcavities in (a) and (b), respectively, measured in the experiment. The resonant wavelengths and Q factors of the cavity modes are shown in the frames.
    Fig. 3. SEM images of FIB-fabricated ultrasmall microcavities with cavity lengths of (a) 0.92 μm and (b) 1.22 μm. (c), (d) Transmission and reflection spectra of the microcavities in (a) and (b), respectively, measured in the experiment. The resonant wavelengths and Q factors of the cavity modes are shown in the frames.
    (a) Distribution of the electric field magnitude, whose polarization is perpendicular to the direction of the through holes in our microcavity, (b) distribution of the electric field magnitude of the interaction between a single PS microparticle with a diameter of 2 μm and the evanescent field of the microcavity, (c) reflection spectra of the microcavity interacting with zero to five PS microparticles in the simulation, (d) redshift of the resonance dip of the microcavity for different numbers of PS microparticles in the simulation.
    Fig. 4. (a) Distribution of the electric field magnitude, whose polarization is perpendicular to the direction of the through holes in our microcavity, (b) distribution of the electric field magnitude of the interaction between a single PS microparticle with a diameter of 2 μm and the evanescent field of the microcavity, (c) reflection spectra of the microcavity interacting with zero to five PS microparticles in the simulation, (d) redshift of the resonance dip of the microcavity for different numbers of PS microparticles in the simulation.
    (a) Schematic diagram of the spectra measurement system. An SLED whose band of output light ranges from 1250 to 1650 nm is implemented as the optical source. A PC is used to control the polarization of the input light. Two OSAs are employed to measure the reflection and transmission spectra, respectively. (b)–(f) Microscope images of the same microcavity with one to five PS microparticles adhered, respectively, which are used for spectra measurement and sensing characterization in the experiment.
    Fig. 5. (a) Schematic diagram of the spectra measurement system. An SLED whose band of output light ranges from 1250 to 1650 nm is implemented as the optical source. A PC is used to control the polarization of the input light. Two OSAs are employed to measure the reflection and transmission spectra, respectively. (b)–(f) Microscope images of the same microcavity with one to five PS microparticles adhered, respectively, which are used for spectra measurement and sensing characterization in the experiment.
    (a) Measured reflection spectra of the microcavity (colored solid lines) interacting with zero to five PS microparticles in the experiment. The dashed line indicates the shift of the resonance dip in the reflection spectrum with variation of the number of PS microparticles. (b) Measured redshift of the resonance dip of the microcavity for different numbers of PS microparticles in the experiment.
    Fig. 6. (a) Measured reflection spectra of the microcavity (colored solid lines) interacting with zero to five PS microparticles in the experiment. The dashed line indicates the shift of the resonance dip in the reflection spectrum with variation of the number of PS microparticles. (b) Measured redshift of the resonance dip of the microcavity for different numbers of PS microparticles in the experiment.
    Yang Yu, Ting-Hui Xiao, Hong-Lian Guo, Zhi-Yuan Li. Sensing of microparticles based on a broadband ultrasmall microcavity in a freely suspended microfiber[J]. Photonics Research, 2017, 5(3): 143
    Download Citation