Abstract
We theoretically design and experimentally realize a broadband ultrasmall microcavity for sensing a varying number of microparticles whose diameter is 2 μm in a freely suspended microfiber. The performance of the microcavity is predicted by the theory of one-dimensional photonic crystals and verified by the numerical simulation of finite-difference time domain and the experimental characterization of reflection and transmission spectra. A penetrating length into the reflectors as small as about four periods is demonstrated in the numerical simulation, giving rise to an ultrasmall effective mode volume that can increase the sensitivity and spatial resolution of sensing. Moreover, a reflection band as large as 150 nm from the reflectors of the microcavity has been realized in silica optical microfiber in the experiment, which highly expands the wavelength range of sensing. Our proposed microcavity integrated into a freely suspended optical fiber offers a convenient and stable method for long-distance sensing of microparticles without the need for complicated coupling systems and is free from the influence of substrates.1. INTRODUCTION
The realization of single-microparticle sensing in free space or the environment plays a critical role in real-time environmental monitoring [1]. Various aerosols and particulate matter (PM) in the air that are extremely harmful to the health of human beings have diameters of several micrometers, such as PM 2.5 and PM 10, whose diameters are no more than 2.5 and 10 μm, respectively [2,3]. Therefore, achieving simple, convenient, and reliable sensing of micro/nanoparticles has attracted a great amount of attention and been extensively investigated by utilizing a variety of methods [4–6]. Among them, solid-state optical microcavities, such as photonic crystal microcavities [7], microdisks [8], microspheres [9], and microtoroids [10], have demonstrated excellent performance in sensing applications due to their commonly ultrahigh quality factors ( factors). However, they also suffer from some disadvantages in long-distance sensing, which essentially requires coupling the sensing signal of these microcavities to optical fibers and waveguides. A common way to realize the coupling of these microcavities to optical transmission devices is to implement tapered fibers or waveguides, but achieving precise, efficient, and stable coupling still remains a challenging problem. Additionally, these solid-state microcavities are normally fabricated on substrates and not freely suspended. The existence of substrates will influence the local environment of sensing, which may decrease the objectivity and accuracy of sensing, especially in environmental monitoring.
In recent years, the optical-fiber-based microcavity has demonstrated significant promise as an alternative for sensing applications, since it can simultaneously perform as a sensor and a waveguide [11–14]. Due to the propagation characteristics of light in optical fiber, most optical-fiber-based microcavities belong to the Fabry–Perot cavity type. Thus, the delicate design of mirrors for Fabry–Perot cavities becomes crucial to the properties of microcavities. The mirrors commonly used in the design include interfaces of fiber ends and defects [15–17] and fiber Bragg gratings [18,19]. A fiber-based Fabry–Perot cavity using two laser-machined interfaces as reflectors that can achieve ultrahigh finesse has been reported [20]. With the assistance of this microcavity, the entangled states of more than 40 atoms and the measurement of the internal state of a single atom have been realized, demonstrating the application potential of fiber-based microcavities in quantum information science [21,22]. On the other hand, in-fiber microcavities with Bragg gratings as reflectors have been proposed for surrounding refractive index sensing [18,19]. However, even though the optical-fiber-based microcavities mentioned above have shown extraordinary performance in some specific fields, they also have some shortcomings, particularly in the application field of environmental monitoring. The microcavity with interfaces as mirrors composed of two independent optical fibers needs to be carefully aligned and integrated, which is not as convenient and stable as in-fiber microcavities, such as Bragg grating microcavities. Nevertheless, the length of a traditional fiber Bragg grating produced by spatial UV irradiation or surface corrugation is always hundreds of periods [23]. Such a long reflector indicates a large mode volume and a large length of a microcavity, and thus decreases the interaction with the surroundings and the spatial resolution of monitoring. Moreover, the narrow bandwidth of traditional fiber Bragg gratings is commonly around several nanometers, severely limiting the operation and monitoring wavelength range [24]. To tackle this problem, a compact broadband microfiber Bragg grating buried in a polymer has been realized experimentally [25], but its loss of flexibility for free suspension is detrimental for sensing applications.
Compared with the above microcavities, in this paper, we have proposed and experimentally fabricated an ultrasmall microcavity with broadband reflectors in a freely suspended microfiber, for the purpose of sensing and counting microparticles whose sizes are vital for environmental monitoring. The properties of our microcavities, including the transmission and reflection spectra, are characterized and compared with the results of numerical simulation. Due to the design of the broadband reflectors, an operation and monitoring wavelength range of more than 150 nm has been achieved in the experiment. Moreover, by applying our microcavity, we have experimentally realized the direct sensing of a varying number of polystyrene (PS) microparticles without a need for complicated coupling systems. The capability of distinguishing the number of microparticles is in agreement with our numerical simulation.
Sign up for Photonics Research TOC. Get the latest issue of Photonics Research delivered right to you!Sign up now
2. THEORETICAL DESIGN OF A MICROCAVITY REFLECTOR
To achieve a microcavity in a broadband fiber with an ultrasmall mode volume for sensing applications, the design of the reflectors of the microcavity plays a key role [26]. The broad bandwidth and small mode volume of the microcavity, respectively, require a large bandgap and a small penetrating length of the reflectors based on a one-dimensional photonic crystal picture. According to the theory of photonic crystal, simultaneously satisfying these two requirements requires a large difference in the refractive indices of the two materials constituting the photonic crystal. Therefore, realizing a large effective refractive index contrast in a silica microfiber becomes the critical problem. The ideal geometric configuration with the largest effective refractive index contrast is illustrated in the inset schematic periodic stack in Fig. 1(a). For the purpose of maximizing the photonic bandgap, both individual silica and air layers periodically arrayed in the stack are a quarter-wavelength in thickness. The dispersion relationship of this ideal geometric configuration is calculated by the transfer-matrix method and displayed in Fig. 1. The relationship between the vacuum wavelength and the real part of dimensionless wave vector , where is the real part of the wave vector and is the period of the stack, demonstrates the bandgap of the configuration. The central wavelength of the bandgap is selected to be 1.55 μm, and the calculated fractional bandgap is 0.24, equal to 375 nm. This wide bandwidth guarantees that the reflectors of the microcavity can work and function at a wide wavelength range for sensing. Moreover, the relationship between the vacuum wavelength and the imaginary part of the dimensionless wave vector , where is the imaginary part of wave vector, reflects the penetrating length into the reflectors at the wavelength range of the bandgap. The imaginary part of the dimensionless wave vector at the central wavelength approaches 0.4, which means that the penetrating length into the reflector is about two and a half periods. This ultrasmall penetrating length originating from the design of the geometric configuration gives rise to the ultrasmall mode volume of our microcavity.
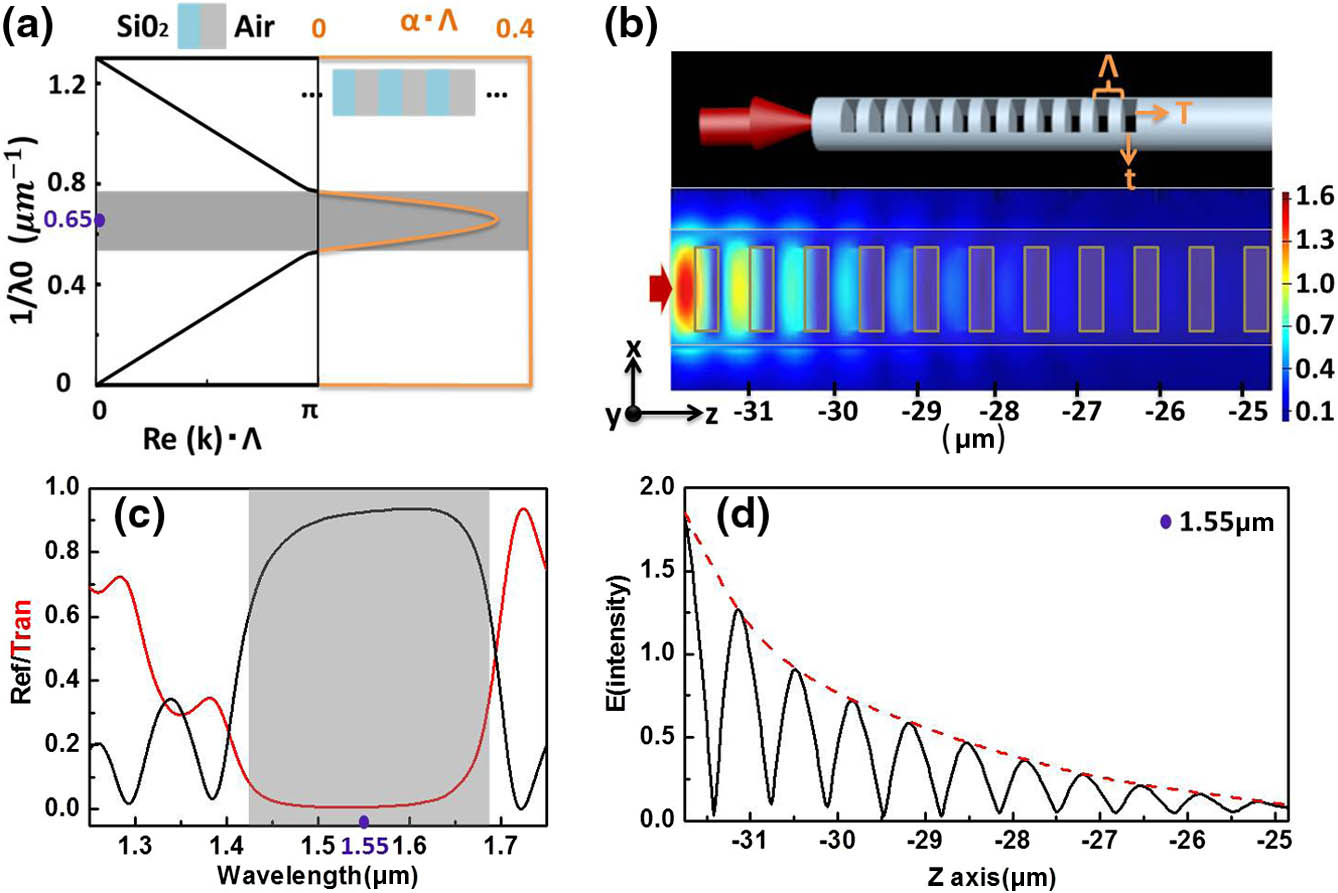
Figure 1.(a) Dispersion relationship of a periodic stack with alternating quarter-wavelength slabs and air. The orange curve refers to the relationship between the frequency and the imaginary part of the dimensionless wave vector. It can be observed that the imaginary part of the dimensionless wave vector reaches its maximum at the center of the bandgap. The inset figure is the schematic diagram of the stack, and the shadow region is its bandgap range. (b) The upper panel is the schematic diagram of our proposed reflector, which is composed of a set of eleven through holes with length , width , and period , respectively equal to 1.2, 0.3, and 0.66 μm. The diameter of the microfiber is 1.7 μm. The lower panel is the distribution of electric field magnitude of the proposed reflector at an incident wavelength of 1.55 μm. The red arrows indicate the position and incident direction of the optical source. (c) Transmission and reflection spectra of the proposed reflector, (d) variation of the electric field magnitude along the axis at the center of the microfiber in the lower panel of (b).
Combined with the above ideal design, the practical implementation should also take the mechanical strength of the geometric configuration into consideration, which means that it is inevitable that we have to sacrifice a little effective refractive index contrast to maintain the capability of mechanically suspending the microfiber for sensing. In practice, we should drill through holes as wide as possible in the microfiber to ensure that the refractive index contrast is as large as possible while the perforated microfiber is still capable of freely suspending. The schematic diagram of the practical geometric configuration is depicted in the upper panel of Fig. 1(b). A set of 11 through holes with the length and width , respectively, equal to 1.2 and 0.3 μm constitute a reflector in the microfiber with a diameter of 1.7 μm. The period of the hole array along the microfiber is 0.66 μm. By using three-dimensional finite-difference time domain (FDTD) simulation, we characterize the performance of our practical reflector. The simulations are conducted with a homemade code in which silica is described as a non-dispersive and non-lossy material whose refractive index is set at 1.444 as a constant and the polarization of the incident wave is parallel to the axis, perpendicular to the direction of the through holes ( axis). As one of the simulation results, the distribution of the electric field magnitude of the reflector at a wavelength of 1.55 μm, which is just at the center of the bandgap, is displayed in the lower panel of Fig. 1(b). It can be observed that the electric field strength decays drastically into the mirror, revealing its capability of realizing an ultrasmall microcavity. More specifically, the variation of the electric field magnitude at the center of the microfiber along the axis in Fig. 1(d) shows that the penetrating length of the reflector, through which the magnitude of the electric field decreases to of the original, is around four periods. The reflection and transmission spectra of the reflector are also calculated by scanning the incident wavelength from 1.25 to 1.75 μm, as illustrated in Fig. 1(c) [27]. The high reflection above 0.6 ranging from 1.42 to 1.68 μm, as shown in the gray region, indicates the broad bandgap of our reflector. Both the small penetrating length and the broadband reflection properties in the simulation of a practical configuration are in agreement with the ideal design above.
3. EXPERIMENTAL FABRICATION AND CHARACTERIZATION OF A MICROCAVITY IN AN OPTICAL FIBER
Based on the theoretical design, we manage to experimentally fabricate a microcavity with the two reflectors designed above in a freely suspended microfiber using a focused ion beam (FIB) technique [28]. We select a silica fiber tapered to 1.7 μm and then drill holes with the parameters of the theoretical design via FIB milling. The cavity length is set at 50 μm, which is suitable for sensing microparticles. The scanning electron microscope (SEM) images of our experimentally fabricated microcavity are shown in Fig. 2(a). To evaluate the design of this device, we first simulate the performance of this microcavity. With the incident wave whose polarization is along the axis, the transmission and reflection spectra of the microcavity are shown in Fig. 2(b). It can be observed in this figure that the magnitude of the reflection spectrum ranging from 1420 to 1680 nm is larger than 0.6, which corresponds to the broadband performance of the reflector. The dips appearing in this reflection spectrum range are the signals modulated by the formed Fabry–Perot microcavity, that is, the longitudinal modes of the cavity. In comparison, we experimentally characterize the performance of our fabricated microcavity via the measurement of transmission and reflection spectra, which are illustrated in Fig. 2(c). We can see that both the height and width of the envelope of reflection spectra around 1.55 μm are not as large as those of numerical simulation shown in Fig. 2(b). This decrease in the width of the bandgap and the transmission rate of the reflector is due to the uncontrollable error of geometric parameters, and the additional loss originates from the roughness in the experimental fabrication. These geometric errors will affect the bandwidth of our reflectors. Another main factor is the additional material loss induced by the gallium implantation in the silica during the FIB milling process. However, a bandgap of 150 nm in width is achieved in the experiment, which is still much wider than those of traditional fiber Bragg gratings. And the value of the envelope of reflection spectra is as high as 0.7. Moreover, compared with the simulation, the widening of the dips in the reflection spectra reflects additional loss in the experiment, which decreases the factor of the microcavity.

Figure 2.(a) SEM of the fabricated microcavity. Reflection and transmission spectra of the microcavity whose cavity length is 50 μm, acquired by (b) FDTD simulation and (c) experimental measurement.
Additionally, due to the small penetrating length into the reflector of our design, we also fabricate the microcavities in freely suspended microfibers with a short cavity length that can realize an ultrasmall mode volume for sensing. SEM images of our fabricated cavity with cavity lengths of 0.92 and 1.22 μm, respectively, are shown in Figs. 3(a) and 3(b). The transmission and reflection spectra of these two microcavities are also measured and displayed in Figs. 3(c) and 3(d), respectively. The single dip in the reflection spectrum around 1.55 μm in Fig. 3(c) is the only longitudinal mode of this short cavity, whose effective mode volume is calculated by in the simulation, which equals . The factor of this cavity mode is deduced from the FWHM of the dip from the experimental reflection spectrum, which equals 93. Similarly, the two longitudinal modes in Fig. 3(d) appear at the edges of the bandgap, with factors of 63 and 67, respectively. The value of the factor of the cavity in the experiment is highly influenced by the fabrication quality. These short microcavities are mechanically strong enough to be freely suspended, hence demonstrating their potential for sensing with high spatial resolution.
Figure 3.SEM images of FIB-fabricated ultrasmall microcavities with cavity lengths of (a) 0.92 μm and (b) 1.22 μm. (c), (d) Transmission and reflection spectra of the microcavities in (a) and (b), respectively, measured in the experiment. The resonant wavelengths and factors of the cavity modes are shown in the frames.
4. SENSING OF MICROPARTICLES BY UTILIZING A MICROCAVITY IN AN OPTICAL FIBER
In order to realize the sensing of a varying number of microparticles, we select a microcavity with a cavity length of 50 μm, whose geometric configuration and spectra are equal to that in Fig. 2. To directly observe the performance of our microcavity, the distribution of the magnitude of an electric field whose polarization is along the axis is simulated and shown in Fig. 4(a). The wavelength of incident light is set at 1594.7 nm, corresponding to the resonance wavelength of the cavity, and thus the standing wave formed can be observed in the microcavity. Also, like the characterization of the single reflector, the two reflectors in the microcavity demonstrate excellent properties such that the magnitude of the electric field rapidly degrades in several periods. Furthermore, we explore the sensing performance of our microcavity by employing PS microspheres with a diameter of 2 μm whose refractive index is 1.5 as microparticles to interact with our microcavity. It can be seen in Fig. 4(b) that the PS microparticles interact with the evanescent field of the microcavity. By monitoring the reflection spectra of the microcavity, we find that the resonance wavelength has a redshift when the PS particles approach the microcavity. The redshift originates from the change in the effective cavity length. When a PS microparticle is close enough to the microcavity that it can interact with the evanescent field, the refractive index of the particle, which is higher than that of air, increases the optical path length of the light propagating in the microcavity. This means that the effective optical cavity length increases due to the interaction. Therefore, the resonance wavelength has a redshift when the interaction occurs. Moreover, the ability of our microcavity to distinguish a varying number of microparticles is investigated. The reflection spectra of our microcavity are monitored when one to five PS microparticles interact with the microcavity. It can be observed in Fig. 4(c) that the resonance dip continuously shifts to longer wavelengths with an increase in the number of PS microparticles. The specific value of the redshift for different numbers of PS microparticles interacting with the microcavity is depicted in Fig. 4(d). The shift value aroused by each PS microparticle is around 0.1 nm, and the increase in the shift value is nearly linear with the increase in the number of PS microparticles. In addition, the factor of the microcavity in theory is also calculated based on the simulation, and is equal to 4000.
Figure 4.(a) Distribution of the electric field magnitude, whose polarization is perpendicular to the direction of the through holes in our microcavity, (b) distribution of the electric field magnitude of the interaction between a single PS microparticle with a diameter of 2 μm and the evanescent field of the microcavity, (c) reflection spectra of the microcavity interacting with zero to five PS microparticles in the simulation, (d) redshift of the resonance dip of the microcavity for different numbers of PS microparticles in the simulation.
Based on the above numerical simulation, we experimentally set up a measurement system and investigate the sensing performance of our experimentally fabricated freely suspended microcavity. The schematic diagram of the measurement system is demonstrated in Fig. 5(a). A broadband superluminescent light emitting diode (SLED) is used as the optical source to provide an input light band ranging from 1250 to 1700 nm. The output light from the SLED first propagates through a depolarizer to eliminate its original status of polarization. Then it passes through a polarization controller (PC) to set its polarization perpendicular to the direction of the through holes on the sample. Before the sample, we add a circulator to extract the reflection spectra from the sample, and we utilize two optical spectrum analyzers (OSAs) to measure the reflection and transmission spectra. Additionally, the microfiber, which is tapered directly from a single mode fiber, is fixed by two fiber clamps on two three-axis stages. We have ensured that they will not affect our experimental results. Our sample is placed under a long-focal-length microscope, which provides adequate space for our freely suspended microcavity. In order to sense different numbers of microparticles, we use a nozzle to directly spray a PS suspension whose concentration is 5% on our microcavity. By this method, we accidentally obtain different numbers of PS microparticles adhering to the microcavity. We use a drop of pure acetone adhering to a dropper to remove the microparticles from the microcavity so that we are able to repeat the measurement with an identical microcavity interacting with a different number of microparticles. After each removal process, we re-measure the transmission and reflection of the microcavity to make sure that the device reverts back to its original status. The microscope images of identical microcavities with one to five PS microparticles adhered are shown in Figs. 5(b)–5(f), respectively, where the reflectors of the microcavity can be clearly observed and the adhering PS microparticles are numbered. We make use of our measurement setup to record the reflection spectra of our samples, as illustrated in Figs. 5(b)–5(f). The same cavity mode in the wavelength range from 1590 to 1600 nm is monitored to study the relationship between the shift in the mode and the number of PS microparticles. It can be seen in Fig. 6(a) that the dip in the reflection spectrum has a continuous redshift with an increase in the number of PS microparticles. The sensitivity of the shift of the cavity mode is about 0.1 nm per PS microparticle, which is equal to that in the numerical simulation. However, the width of the dip in the experiment, corresponding to the factor of the microcavity, is much larger than that in the numerical simulation. The factor in the experiment based on our characterization is about 700, smaller than that in theory. This difference originates from the additional loss in our microcavity that is induced by nanofabrication imperfections and contamination. For example, the inner walls of the fabricated air holes are not completely vertical, which decreases the confinement of our microcavity, thus leading to loss. More important, the gallium ion implantation in silica resulting from the FIB milling process contaminates the microcavity and causes significant material loss. Nevertheless, a high- microcavity in a freely suspended microfiber based on this design can be expected with improvements in nanofabrication techniques.
Figure 5.(a) Schematic diagram of the spectra measurement system. An SLED whose band of output light ranges from 1250 to 1650 nm is implemented as the optical source. A PC is used to control the polarization of the input light. Two OSAs are employed to measure the reflection and transmission spectra, respectively. (b)–(f) Microscope images of the same microcavity with one to five PS microparticles adhered, respectively, which are used for spectra measurement and sensing characterization in the experiment.
Figure 6.(a) Measured reflection spectra of the microcavity (colored solid lines) interacting with zero to five PS microparticles in the experiment. The dashed line indicates the shift of the resonance dip in the reflection spectrum with variation of the number of PS microparticles. (b) Measured redshift of the resonance dip of the microcavity for different numbers of PS microparticles in the experiment.
5. CONCLUSION
In conclusion, we have experimentally realized the sensing of different numbers of microparticles, which is crucial in environmental monitoring, by utilizing a delicately designed microcavity with broadband reflectors in a freely suspended microfiber. The reflectors of the microcavity are theoretically designed via a combination of theory regarding one-dimensional photonic crystals and numerical simulation of a practical implementation, which finally achieves a reflection band as wide as 150 nm experimentally, largely expanding the sensing and monitoring wavelength range, especially compared with the microcavities using traditional fiber Bragg gratings as reflectors. Also, due to the short penetrating length through the reflector, the effective mode volume is much smaller than that of microcavities based on fiber Bragg gratings having the same cavity length. The minimization of the effective mode volume can not only enhance the interaction between the microcavity and the microparticles used for sensing, but also increase the spatial resolution of sensing applications. Compared with solid-state microcavities, our microcavity used for sensing is integrated in freely suspended optical fiber so that it conveniently realizes long-distance sensing without the need for a complicated coupling system and is free from the influence of substrates, which enhances its stability and accuracy for environmental monitoring. Our microcavity provides a promising tool to achieve sensing of microparticles in environmental monitoring.
References
[1] J. Wang, C. Aegerter, X. Xu, J. J. Szykman. Potential application of VIIRS day/night band for monitoring nighttime surface PM2.5 air quality from space. Atmos. Environ., 124, 55-63(2016).
[2] S. Weichenthal, E. Lavigne, G. Evans, K. Pollitt, R. T. Burnett. Ambient PM2.5 and risk of emergency room visits for myocardial infarction: impact of regional PM2.5 oxidative potential: a case-crossover study. Environ. Health, 15, 46(2016).
[3] C. Monn, S. Becker. Cytotoxicity and induction of proinflammatory cytokines from human monocytes exposed to fine (PM2.5) and coarse particles (PM10-2.5) in outdoor and indoor air. Toxicol. Appl. Pharm., 155, 245-252(1999).
[4] J. Su, A. F. G. Goldberg, B. M. Stoltz. Label-free detection of single nanoparticles and biological molecules using microtoroid optical resonators. Light Sci. Appl., 5, e16001(2016).
[5] S. Mandal, J. M. Goddard, D. Erickson. A multiplexed optofluidic biomolecular sensor for low mass detection. Lab Chip, 9, 2924-2932(2009).
[6] H. Shafiee, E. A. Lidstone, M. Jahangir, F. Inci, E. Hanhauser, T. J. Henrich, D. R. Kuritzkes, B. T. Cunningham, U. Demirci. Nanostructured optical photonic crystal biosensor for HIV viral load measurement. Sci. Rep., 4, 4116(2014).
[7] F. Liang, Q. Quan. Detecting single gold nanoparticles (1.8 nm) with ultrahigh-Q air-mode photonic crystal nanobeam cavities. ACS Photon., 2, 1692-1697(2015).
[8] B.-Q. Shen, X.-C. Yu, Y. Zhi, L. Wang, D. Kim, Q. Gong, Y.-F. Xiao. Detection of single nanoparticles using the dissipative interaction in a high-Q microcavity. Phys. Rev. Appl., 5, 024012(2016).
[9] F. Vollmer, S. Arnold, D. Keng. Single virus detection from the reactive shift of a whispering-gallery mode. Proc. Natl. Acad. Sci. USA, 105, 20701-20704(2008).
[10] J. Zhu, S. K. Ozdemir, Y.-F. Xiao, L. Li, L. He, D.-R. Chen, L. Yang. On-chip single nanoparticle detection and sizing by mode splitting in an ultrahigh-Q microresonator. Nat. Photonics, 4, 46-49(2010).
[11] L. A. Tempelman, K. D. King, G. P. Anderson, F. S. Ligler. Quantitating staphylococcal enterotoxin B in diverse media using a portable fiber-optic biosensor. Anal. Biochem., 233, 50-57(1996).
[12] L. Jiang, J. Yang, S. Wang, B. Li, M. Wang. Fiber Mach–Zehnder interferometer based on microcavities for high-temperature sensing with high sensitivity. Opt. Lett., 36, 3753-3755(2011).
[13] F. C. Favero, L. Araujo, G. Bouwmans, V. Finazzi, J. Villatoro, V. Pruneri. Spheroidal Fabry–Perot microcavities in optical fibers for high-sensitivity sensing. Opt. Express, 20, 7112-7118(2012).
[14] J. Ma, W. Jin, H. L. Ho, J. Y. Dai. High-sensitivity fiber-tip pressure sensor with graphene diaphragm. Opt. Lett., 37, 2493-2495(2012).
[15] J. Ma, J. Ju, L. Jin, W. Jin, D. Wang. Fiber-tip micro-cavity for temperature and transverse load sensing. Opt. Express, 19, 12418-12426(2011).
[16] A. Muller, E. B. Flagg, J. R. Lawall, G. S. Solomon. Ultrahigh-finesse, low-mode-volume Fabry–Perot microcavity. Opt. Lett., 35, 2293-2295(2010).
[17] Y. Wang, D. Wang, C. Liao, T. Hu, J. Guo, H. Wei. Temperature-insensitive refractive index sensing by use of micro Fabry–Perot cavity based on simplified hollow-core photonic crystal fiber. Opt. Lett., 38, 269-271(2013).
[18] Q. Zhang, L. Hu, Y. Qi, G. Liu, N. Ianno, M. Han. Fiber-optic refractometer based on a phase-shifted fiber Bragg grating on a side-hole fiber. Opt. Express, 23, 16750-16759(2015).
[19] K. Zhou, Z. Yan, L. Zhang, I. Bennion. Refractometer based on fiber Bragg grating Fabry–Perot cavity embedded with a narrow microchannel. Opt. Express, 19, 11769-11779(2011).
[20] D. Hunger, T. Steinmetz, Y. Colombe, C. Deutsch, T. W. Hänsch, J. Reichel. A fiber Fabry–Perot cavity with high finesse. New J. Phys., 12, 065038(2010).
[21] F. Haas, J. Volz, R. Gehr, J. Reichel, J. Estève. Entangled states of more than 40 atoms in an optical fiber cavity. Science, 344, 180-183(2014).
[22] J. Volz, R. Gehr, G. Dubois, J. Estève, J. Reichel. Measurement of the internal state of a single atom without energy exchange. Nature, 475, 210-213(2011).
[23] K. O. Hill, B. Malo, F. Bilodeau, D. Johnson, J. Albert. Bragg gratings fabricated in monomode photosensitive optical fiber by UV exposure through a phase mask. Appl. Phys. Lett., 62, 1035-1037(1993).
[24] K. O. Hill, G. Meltz. Fiber Bragg grating technology fundamentals and overview. J. Lightwave Technol., 15, 1263-1276(1997).
[25] M. Ding, M. N. Zervas, G. Brambilla. A compact broadband microfiber Bragg grating. Opt. Express, 19, 15621-15626(2011).
[26] W. Ding, R. J. Liu, Z. Y. Li. Reducing radiation losses of one-dimensional photonic-crystal reflectors on a silica waveguide. Opt. Express, 20, 28641-28654(2012).
[27] P. Lalanne, S. Mias, J. P. Hugonin. Two physical mechanisms for boosting the quality factor to cavity volume ratio of photonic crystal microcavities. Opt. Express, 12, 458-467(2004).
[28] Y. Yu, W. Ding, L. Gan, Z.-Y. Li, Q. Luo, S. Andrews. Demonstration of broad photonic crystal stop band in a freely-suspended microfiber perforated by an array of rectangular holes. Opt. Express, 22, 2528-2535(2014).


