• Laser & Optoelectronics Progress
  • Vol. 58, Issue 22, 2200003 (2021)
Jun Jiao, Yang Sheng, Biao Wang, Qingxiao Ma, Chun Li, and Ling Jiang*
Author Affiliations
  • College of Information Science and Technology, Nanjing Forestry University, Nanjing, Jiangsu 210037, China
  • show less
    DOI: 10.3788/LOP202158.2200003 Cite this Article Set citation alerts
    Jun Jiao, Yang Sheng, Biao Wang, Qingxiao Ma, Chun Li, Ling Jiang. Research Progress on Spectroscopy in Walnut Detection[J]. Laser & Optoelectronics Progress, 2021, 58(22): 2200003 Copy Citation Text show less
    Hyperspectral imaging system
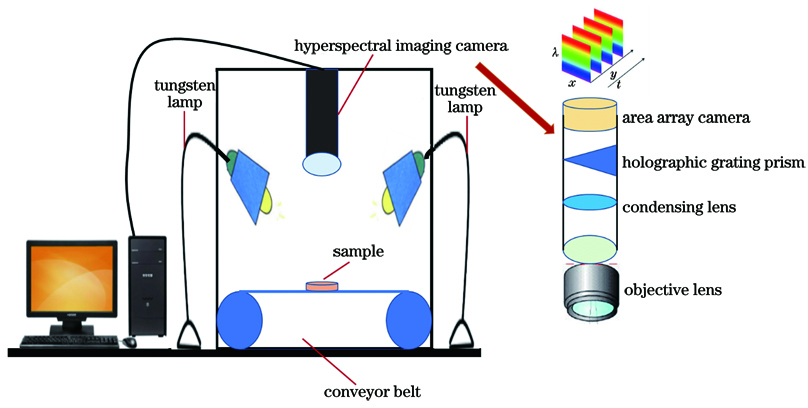
    Fig. 1. Hyperspectral imaging system
    Infrared spectroscopy analysis system. (a) Fourier transform infrared spectroscopy system; (b) terahertz time domain spectroscopy system
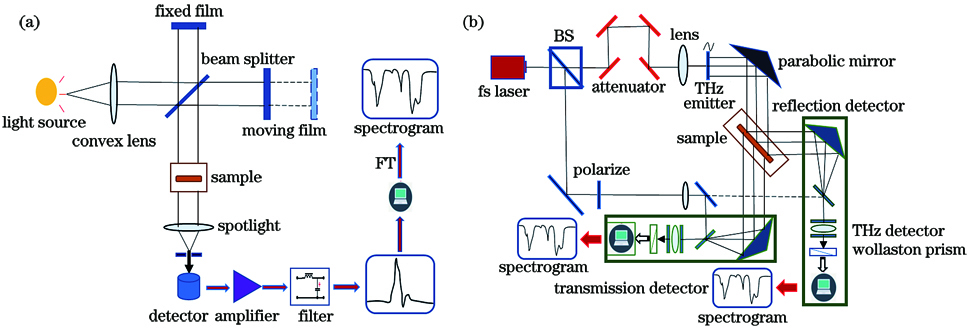
    Fig. 2. Infrared spectroscopy analysis system. (a) Fourier transform infrared spectroscopy system; (b) terahertz time domain spectroscopy system
    Spectrogram. (a) Original spectra of near-infrared diffuse reflectance absorbance of five walnut shells[20]; (b) terahertz absorption spectra of four walnut kernels
    Fig. 3. Spectrogram. (a) Original spectra of near-infrared diffuse reflectance absorbance of five walnut shells[20]; (b) terahertz absorption spectra of four walnut kernels
    Mid-infrared spectra of walnut kernel[21]. (a) Spectra of walnut from 4 producing areas; (b) spectra of 10 varieties of walnut
    Fig. 4. Mid-infrared spectra of walnut kernel[21]. (a) Spectra of walnut from 4 producing areas; (b) spectra of 10 varieties of walnut
    Near-infrared spectra of walnut kernel[32]. (a) Original spectra; (b) pretreated spectra
    Fig. 5. Near-infrared spectra of walnut kernel[32]. (a) Original spectra; (b) pretreated spectra
    Terahertz spectra of walnut shell and kernel with different concentrations combined with polyethylene[41]
    Fig. 6. Terahertz spectra of walnut shell and kernel with different concentrations combined with polyethylene[41]
    Comparison itemTraditional spectrumHyperspectrum
    Band numberLessA lot
    Resolving power>100 nm10--20 nm
    AtlasDetachedConsolidated
    Is the channel continuousDiscontinuousSuccessive
    Table 1. Comparison of hyperspectrum and traditional spectrum
    Preprocessing algorithmMethodApplication and characteristics
    Data enhancementMean centralization,Redundant data are deleted to enhance the difference between the data.
    standardization,
    normalization
    SmoothingCar average,The average value of spectral information data is obtained by multiple measurements to reduce the random error and improve the signal-to-noise ratio.
    moving average smoothing,
    convolution smoothing
    DerivativeDifference,The interference caused by baseline drift or flat background can be eliminated, overlapping peaks can be resolved, and resolution and sensitivity can be improved.
    first derivative,
    second derivative
    Light scattering correctionMultivariate scattering correction,It is mainly used to eliminate the scattering phenomenon caused by uneven particle distribution and particle size.
    standard normal variable transformationIt is mainly used to eliminate the influence of solid particle size, surface scattering, and optical path transformation on diffuse reflection.
    Fourier transformIt can not only decompose the original data into sine wave, but also compress, filter, and smooth the original data.
    Wavelet transformAccording to the different frequency, the chemical signal is decomposed into a variety of scale components, and the corresponding sampling step size is adopted to achieve the complete extraction of the signal data.
    Table 2. Data preprocessing methods applied to spectral analysis
    MethodApplication and characteristics
    Principal component analysis (PCA)It is an unsupervised dimensionality reduction technology, which can keep the most effective information and simplify the calculation.
    Support vector regression (SVR)It is an algorithm through finding the optimal hyperplane to minimize the total deviation of all sample points from the hyperplane.
    Partial least square (PLS)It is used for linear regression analysis of data, and is often used for quantitative analysis.
    Multiple linear regression (MLR)It is simple in calculation and suitable for regression analysis with less variables.
    Linear discriminant analysis (LDA)It is a supervised learning dimensionality reduction technique. Each sample of the data set has a category output.
    Cluster analysis (CA)Classification using the principle of similarity, K-means and k-center algorithms are common in data classification.
    Genetic algorithm (GA)A subset search algorithm is based on biological evolution theory and natural selection.
    Artificial neutral network (ANN)Parallel distributed system, adaptive, self-organizing, and real-time learning pattern classification.
    Simple linear regression (SLR)The simplest linear regression is to study the covariance between variables.
    Ordinary least square (OLS)It can find the best matching function by summing the squared sum of the actual value and the minimum value of the fitted value.
    Support vector machine (SVM)The model has excellent generalization ability and good robustness, which can solve the classification problem of a small number of samples.
    Table 3. Chemometrics methods applied to spectral analysis
    TargetTraditional chemical methodTheoryCharacteristic
    Water contentDrying test methodBased on the characteristics of water evaporation, the samples were dried continuously at 100--105 ℃ to make the water volatilize. According to the weight loss, the corresponding water content (%) could be calculated.The sample must contain no or little volatile components
    ProteinKjeldahl determinationThe sample reacts with concentrated sulfuric acid and catalyst for heating, then the nitrogen is dissociated by alkali distillation, absorbed by boric acid, titrated with hydrochloric acid standard solvent, and the protein content is obtained by conversion.Low sensitivity and long time consuming
    Coomassie brilliant blueCoomassie brilliant blue reacts with the protein in the sample to produce colored substance. The content of protein can be determined by measuring the optical density of the reactant in the ultraviolet spectrophotometer.High sensitivity and short time consuming
    FatSoxhlet extraction methodThe fat in the sample is dissolved in the organic solvent ether, and the content of the crude fat can be obtained by extracting the sample circularly and weighing the extracted crude fat.High sensitivity and time consuming
    Table 4. Traditional chemical measurement methods
    Jun Jiao, Yang Sheng, Biao Wang, Qingxiao Ma, Chun Li, Ling Jiang. Research Progress on Spectroscopy in Walnut Detection[J]. Laser & Optoelectronics Progress, 2021, 58(22): 2200003
    Download Citation