• Chinese Optics Letters
  • Vol. 21, Issue 9, 092501 (2023)
Horacio Soto-Ortiz* and Gerson Torres-Miranda
Author Affiliations
  • Applied Physics Division, Center for Scientific Research and Higher Education of Ensenada, Ensenada 22860, Mexico
  • show less
    DOI: 10.3788/COL202321.092501 Cite this Article Set citation alerts
    Horacio Soto-Ortiz, Gerson Torres-Miranda. Piezoelectric constant temperature dependence in strained [111]-oriented zinc-blende MQW-SOAs[J]. Chinese Optics Letters, 2023, 21(9): 092501 Copy Citation Text show less
    Experimental setup. Solid, dashed, and double solid lines: optical fibers, electrical links, and free-space optical links. Lp and Lc, tunable laser; PC1 and PC2, polarization controller; G1, G2, G3, pigtailed graded-index lens collimator; ISO1 and ISO2, Faraday isolator; B1, beam splitter; OL1 and OL2, objective lens; SOA, MQW-SOA; OSA, optical spectrum analyzer; PE, Peltier element; S1, electric switch; V, digital multimeter; TTC, thermoelectric temperature controller.
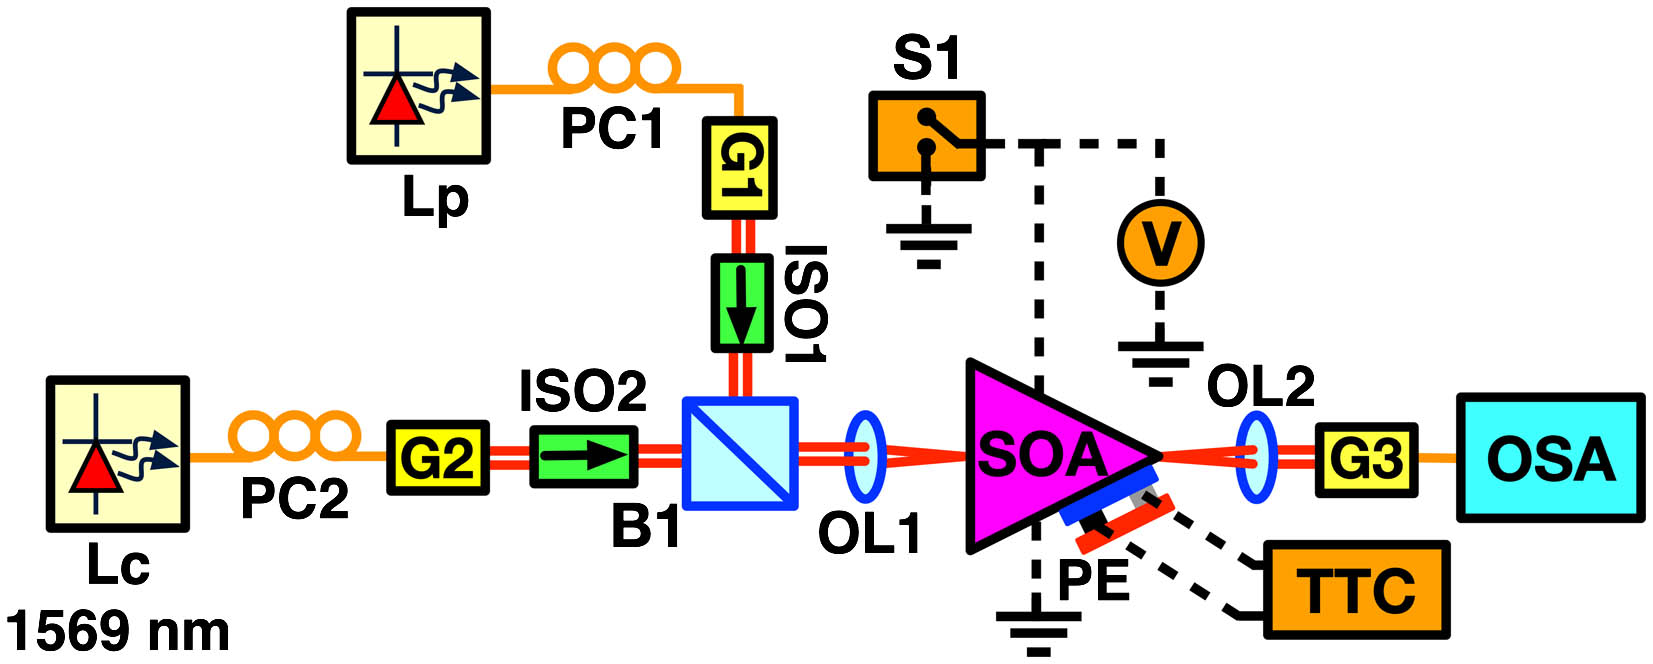
    Fig. 1. Experimental setup. Solid, dashed, and double solid lines: optical fibers, electrical links, and free-space optical links. Lp and Lc, tunable laser; PC1 and PC2, polarization controller; G1, G2, G3, pigtailed graded-index lens collimator; ISO1 and ISO2, Faraday isolator; B1, beam splitter; OL1 and OL2, objective lens; SOA, MQW-SOA; OSA, optical spectrum analyzer; PE, Peltier element; S1, electric switch; V, digital multimeter; TTC, thermoelectric temperature controller.
    Transmission spectra for Pin1 = −15.9 dBm and Pin2 = −4.53 dBm (indicated with solid and dashed arrows, respectively) at 18, 23, and 28°C under SCC (upper spectra) and OCC (lower spectra). Marks and traces are the measured values and their interpolations.
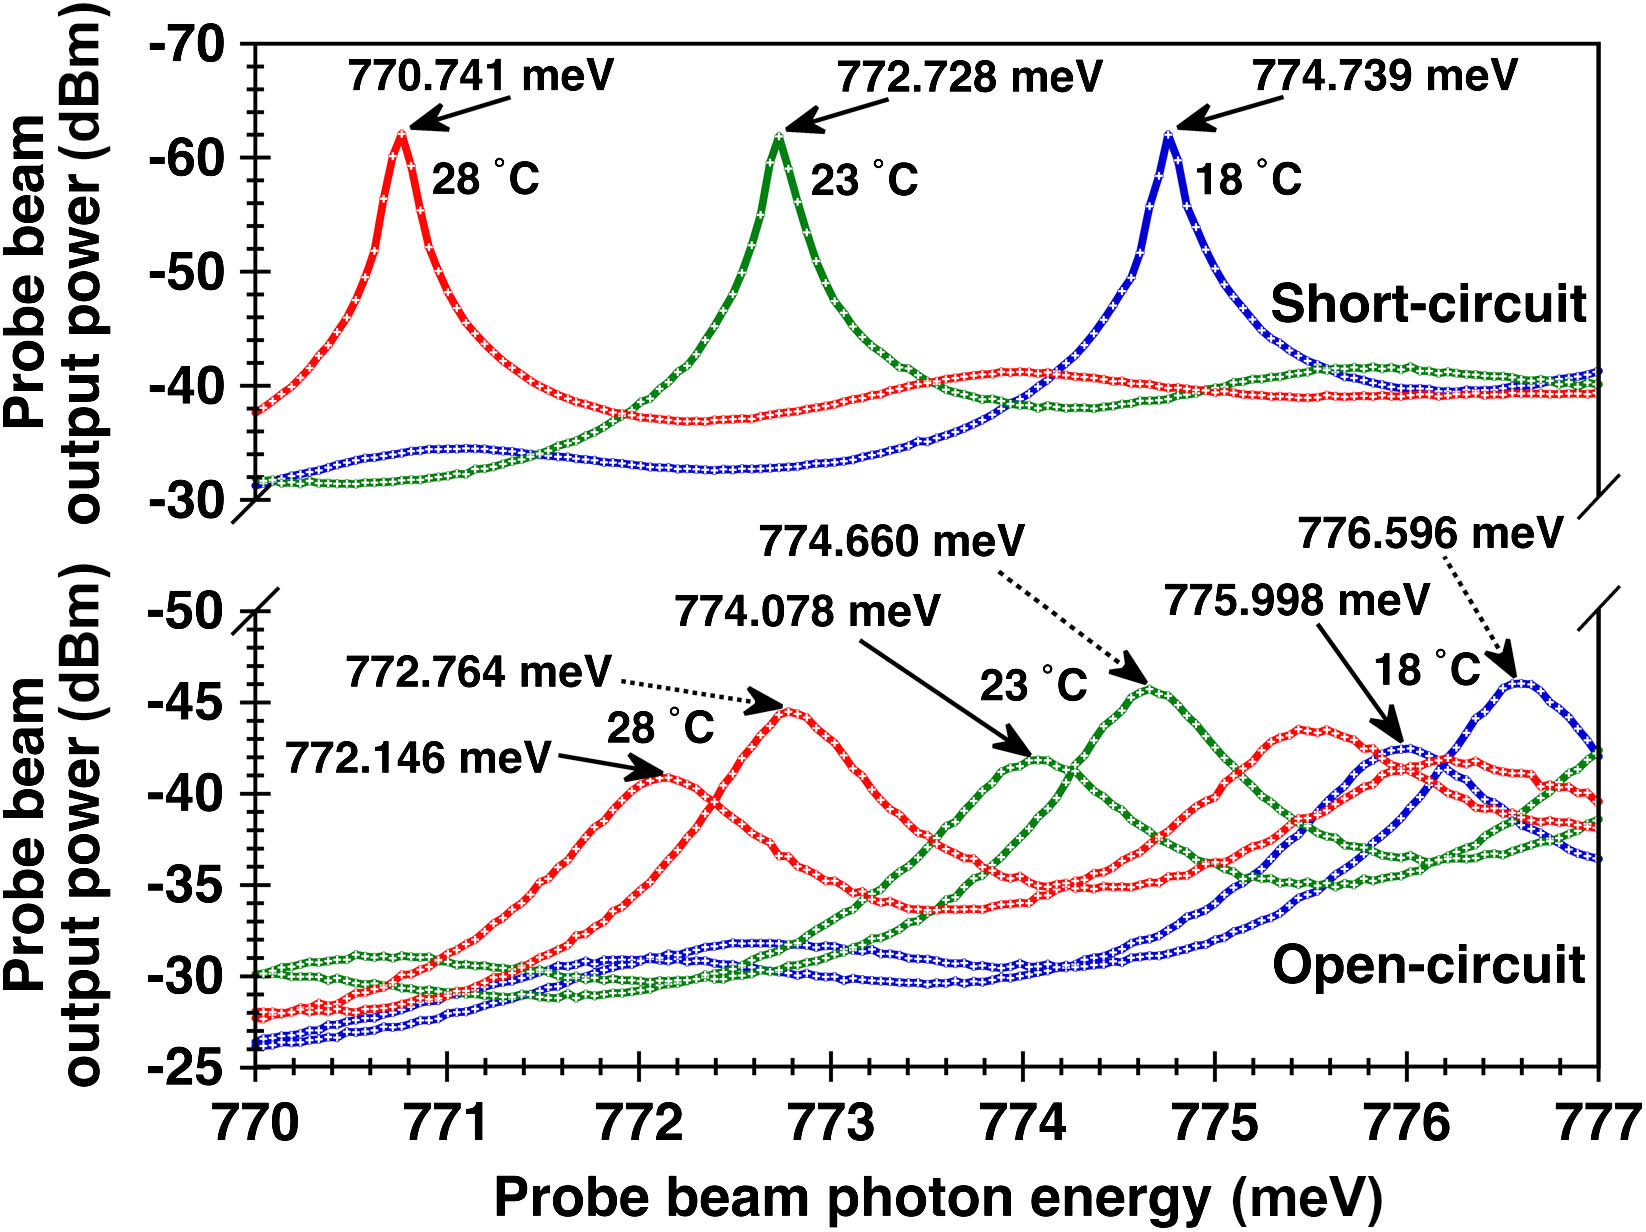
    Fig. 2. Transmission spectra for Pin1 = −15.9 dBm and Pin2 = −4.53 dBm (indicated with solid and dashed arrows, respectively) at 18, 23, and 28°C under SCC (upper spectra) and OCC (lower spectra). Marks and traces are the measured values and their interpolations.
    Exsc,oc1,2 and Vbt1,2 versus temperature. Marks and traces are the measured values and their linear interpolations accompanied by their respective formulas.
    Fig. 3. Exsc,oc1,2 and Vbt1,2 versus temperature. Marks and traces are the measured values and their linear interpolations accompanied by their respective formulas.
    e14e, A¯ehh, and ΔEssc versus temperature (upper, middle, and lower graphs) calculated using experimentally obtained values (open crosses) and interpolated values (open circles and their interpolations with solid lines) of Exsc,oc1,2 and Vbt1,2.
    Fig. 4. e14e, A¯ehh, and ΔEssc versus temperature (upper, middle, and lower graphs) calculated using experimentally obtained values (open crosses) and interpolated values (open circles and their interpolations with solid lines) of Exsc,oc1,2 and Vbt1,2.
    1Se-hhER energy versus total input power at 18, 23, and 28°C. Marks and traces are the measured values and their interpolations.
    Fig. 5. 1Se-hhER energy versus total input power at 18, 23, and 28°C. Marks and traces are the measured values and their interpolations.
    Horacio Soto-Ortiz, Gerson Torres-Miranda. Piezoelectric constant temperature dependence in strained [111]-oriented zinc-blende MQW-SOAs[J]. Chinese Optics Letters, 2023, 21(9): 092501
    Download Citation