
Horacio Soto-Ortiz, Gerson Torres-Miranda. Piezoelectric constant temperature dependence in strained [111]-oriented zinc-blende MQW-SOAs[J]. Chinese Optics Letters, 2023, 21(9): 092501
- Chinese Optics Letters
- Vol. 21, Issue 9, 092501 (2023)
Abstract
Keywords
1. Introduction
Due to the abrupt changes in absorption and refractive index that the quantum-confined Stark effect (QCSE) can potentially induce in a low-dimensional structure, this mechanism has excellent potential for developing ultra-fast all-optical functions for telecommunications systems using strained [111]-oriented zinc-blende multiple quantum well semiconductor optical amplifiers (MQW-SOAs)[1,2]. Indeed, these amplifiers, compared to the massive ones, exhibit higher differential gains, lower noise figures, and, notably, an internal piezoelectric field that is mainly responsible for the QCSE when they are unbiased[3,4]. Therefore, to estimate the temperature dependence of the QCSE in MQW-SOAs and thus be able to use it as a contribution to tune the energy of the excitonic resonances where required for a specific application, it is crucial to determine the temperature dependence of the piezoelectric constant . Some authors estimate using linear interpolation between the piezoelectric constant values of the relevant binary semiconductors of the alloy of the quantum wells (QWs)[3,5]. Nevertheless, this procedure generates larger values than those obtained experimentally. Concerning the piezoelectric constant experimental determination in QWs, typically, is used as an adjustment parameter in theoretical models to fit the calculated values of the energies of determined electronic transitions affected by the QCSE, to those obtained experimentally[6]. is also estimated by extracting key parameters from the Franz–Keldysh oscillations that allow its indirect determination[7]. However, in structures where, during the growth of the monolayers of the QW alloy, the surface segregation phenomenon can occur, the experimental determination becomes complex since this phenomenon produces a blue shift of the fundamental transition energy[8–10]. Therefore, methods used for determining , based on the calculations of the energy levels, should consider this effect, although it is rarely included in them and probably because it substantially increases their degree of difficulty. Furthermore, when these methods are used to calculate as a function of temperature, they have the drawback that temperature also has a marked effect on the bandgap energy of the material constituting the QWs. Thus, as the temperature fluctuates, the energy of the electronic transitions or the extremes of the Franz–Keldysh oscillations is simultaneously affected by two remarkable effects: the temperature dependence that the bandgap energy presents and that exhibited by the piezoelectric constant. These simultaneous effects may generate erroneous experimental results or, at best, complicate its experimental determination.
Here, we use a simple method for experimentally determining the effective piezoelectric constant , as a function of temperature, in strained zinc-blende QWs grown along the [111] direction of SOAs with a p-iMQW-n diode structure. Because the surface segregation phenomenon can impose a profile of values on , by effective piezoelectric constant, we mean the global magnitude that is assigned to . The used method, based on the determination of the relative Stark shifts that the QCSE induces in the fundamental excitonic resonance when the electrodes of the MQW-SOA under test are short- and open-circuited, is insensitive to the variation of the bandgap energy with temperature. Likewise, the method is insensitive to the bandgap energy shift that may cause the surface segregation phenomenon. Even though the method was used to determine in an MQW-SOA, it can be applied to any p-iMQW-n diode structure with electrodes and strained identical zinc-blende QWs grown along the [111] direction. In particular, we estimated in a temperature range of interest for telecommunication applications (18–28°C).
2. Methods
In strained zinc-blende QWs grown along the [111] direction of unbiased SOAs with a p-iMQW-n diode structure, the excitonic transition energy from the first electronic state to the first heavy-hole state (1s e-hh) can be represented as follows when the amplifier electrodes are short-circuited () or open-circuited ():
Sign up for Chinese Optics Letters TOC. Get the latest issue of Chinese Optics Letters delivered right to you!Sign up now
In the present analysis, it was assumed the MQW-SOA structure under study is composed of identical QWs, and the and piezoelectric fields are the same in all the wells. Based on these considerations, can be given by[4]
Considering that causes a negligible change in , from Eq. (1), the energy difference () existing between the energies under open- and short- circuit conditions (OCC and SCC) becomes practically equal to the total Stark shift difference () experiencing under OCC and SCC[11]. Indeed, since the energies and are defined by Eq. (1), their difference, for the same temperature, causes the cancellation of , , and , and therefore of the effects of temperature and segregation phenomenon on . Consequently, is given in eV by[11,12]
Here, and are the values that and assume, respectively, when the input power is . On the other hand, using two input powers, and , a system of two coupled equations can be obtained from Eq. (5), whose resolution results in the following expression for :
For notation simplicity, in Eqs. (5)–(9), the temperature dependence of , , , , , , and is omitted.
According to what is established above, by substituting Eq. (3) and Eqs. (6)–(9) into Eq. (5), and measuring and for different temperatures, it is possible to determine .
3. Results and Discussion
Now, we use the procedure explained above for estimating the value within the [111]-oriented strained QWs of an unbiased MQW-SOA. The amplifier comprises a p-iMQW-n structure with a 2.2-µm-wide and 0.1-µm-thick intrinsic active region incorporating a central section, with eight QWs separated by seven barriers clad on both sides by a 28.4-nm-thick undoped separate-confinement heterostructure (SCH). The QW and barrier widths are nominally 1.2 nm and 4.8 nm, respectively, and the QWs are subjected to a compressive lattice mismatch strain of . Moreover, and .
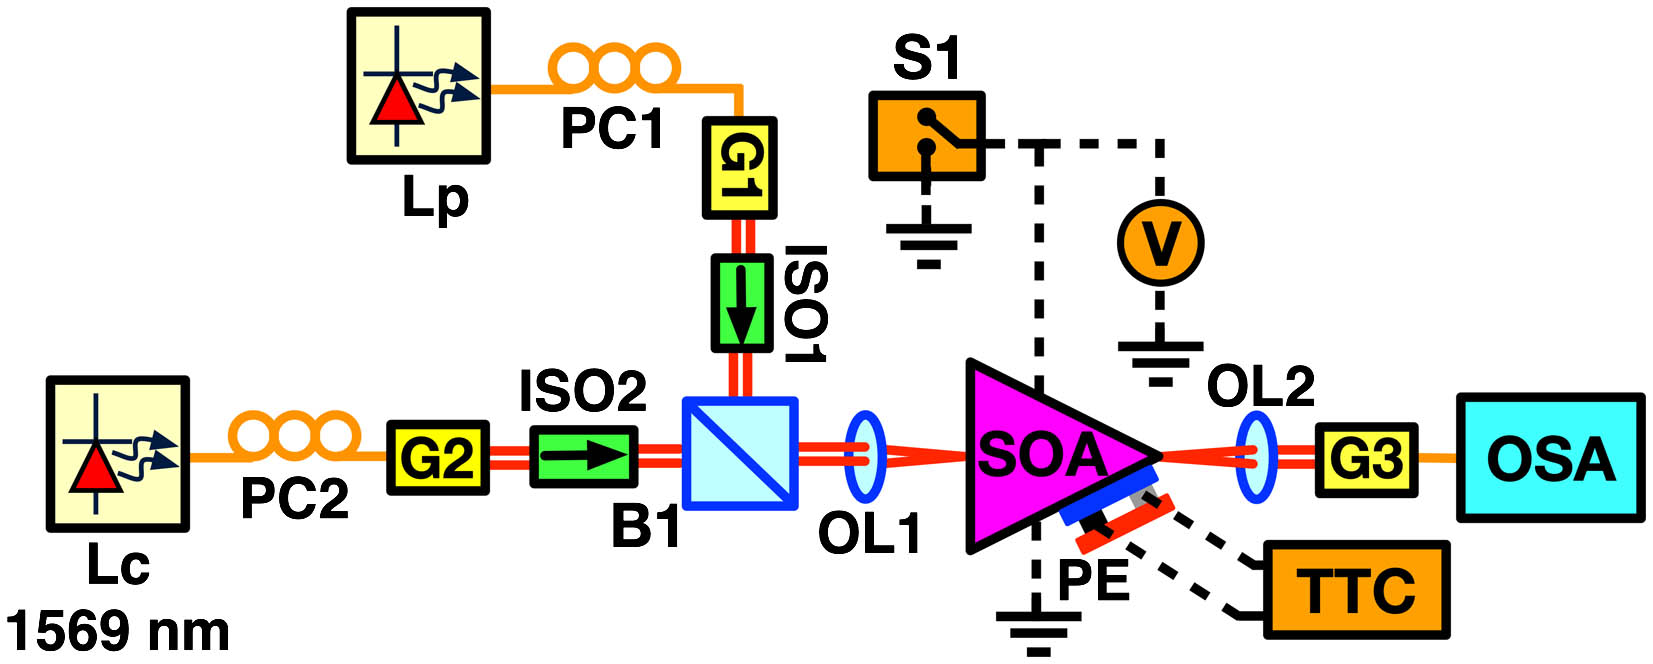
First, we determine when the total input power is in the temperature range from 18 to 28°C. For this purpose, we use the setup shown in Fig. 1. where a probe beam and a control beam, whose photon energy (1569 nm) is located well within the continuum spectrum, are launched in co-propagation into the amplifier with horizontal linear polarization. At a specific temperature within the range from 18 to 28°C, the probe beam wavelength is swept across the spectral width, keeping its input power constant at . For each examined wavelength and each total input power, defined as the sum of the input powers of the control and probe beams, the probe beam power at the amplifier output is determined, under SCC and OCC (using switch S1 in Fig. 1), via an optical spectrum analyzer (OSA) with a wavelength accuracy of (see Fig. 1). Figure 2 shows the obtained transmission spectra, around , for the probe beam when the total input powers are and , and the amplifier temperatures are set at 18, 23, and 28°C under OCC. For the same temperatures but under SCC, Fig. 2 shows only transmission spectra obtained with a total input power of since these are identical to those acquired with a total input power of . Effectively, under steady-state and SCC, and becomes input power independent because the photogenerated carriers quickly escape from the QWs and are immediately drained by the MQW-SOA electrodes. Consequently, there are no free carriers inside or outside the QWs that can establish piezoelectric field screening mechanisms modifying the QCSE[4].
![]()
Figure 1.Experimental setup. Solid, dashed, and double solid lines: optical fibers, electrical links, and free-space optical links. Lp and Lc, tunable laser; PC1 and PC2, polarization controller; G1, G2, G3, pigtailed graded-index lens collimator; ISO1 and ISO2, Faraday isolator; B1, beam splitter; OL1 and OL2, objective lens; SOA, MQW-SOA; OSA, optical spectrum analyzer; PE, Peltier element; S1, electric switch; V, digital multimeter; TTC, thermoelectric temperature controller.
![]()
Figure 2.Transmission spectra for Pin1 = −15.9 dBm and Pin2 = −4.53 dBm (indicated with solid and dashed arrows, respectively) at 18, 23, and 28°C under SCC (upper spectra) and OCC (lower spectra). Marks and traces are the measured values and their interpolations.
Figure 2 clearly shows how, with rising temperature, the energy (indicated by arrows) red shifts. This is because decreases with temperature, causing to increase [see Eq. (2)]. Therefore, the deformation of the QWs is enhanced, resulting in a decrease in the carrier quantization energy. In particular, under SCC, the spectral position is shifted from 774.739 to 770.741 meV when the MQW-SOA temperature changes from 18 to 28°C, which corresponds to a tuning span of 4 meV (8.3 nm). From this figure, , at 23°C, turns out to be approximately equal to for , and for . On the other hand, with the probe beam photon energy matching the central energy, the voltages and are measured with an accuracy of , under OCC, using a 6.5 digit multimeter in diode test mode (denoted as V in Fig. 1) for and , respectively.
Now, using Eqs. (3) and (5)–(9), as well as the found values for and , at 23°C can be determined. Similarly, can be estimated for any temperature. For clarity, Fig. 2 only shows the transmission spectra for 18, 23, and 28°C. However, the experimental determination of the energy under SCC () and OCC () and the voltages was performed for eleven temperatures. Expressly, the MQW-SOA temperature was varied using a Peltier element (PE) and a thermoelectric temperature controller (TTC) with accuracy (see Fig. 1). The results are presented in Fig. 3, where the experimental data for , , and are shown with their linear interpolations accompanied by their respective formulas.
![]()
Figure 3.
Figure 4 shows the , , and values (open crosses) calculated as a function of temperature using Eqs. (3), (5)–(9) and the last term on the right-hand side (RHS) of Eq. (4) together with the experimentally obtained values of and reported in Fig. 3 (marks).
![]()
Figure 4.e14e,
These parameters were also calculated using the linear interpolation formulas for and given in Fig. 3, resulting in the values represented with open circles in Fig. 4. Moreover, the precisions , , and with which the , , and values were extracted from the experimental data are represented in the graphs of Fig. 4 with error bars and were obtained in a manner similar to that described in Ref. [11]. Due to the high absorption of the , the OSA noise floor generates inaccuracies in the determination of , which is the main cause of the dispersion of the , , and values represented with open crosses in Fig. 4. However, all these values, calculated directly with the experimental data reported in Fig. 3 (marks), do not exceed the limits of the error bars, which validates the precision wherewith , , and are estimated. In particular, the extracted values at 18, 23, and 28°C are , , and , respectively, i.e., in the analyzed temperature range, the result accuracy is approximately equal to , which is similar to that obtained by other methods extracting the value[13]. Moreover, as expected, these values, and in general all those reported in the upper graph of Fig. 4, evidence that the magnitude tends to decrease as temperature increases. Indeed, as temperature rises, the electric dipole randomization increases. Hence, the strain-induced polarization decreases together with .
It is relevant to mention that this behavior is contrary to that observed in other previously published work where the piezoelectric constant magnitude in QWs increases as temperature increases, for which no convincing explanation has been presented[13–17]. To gain more insight into this contradictory aspect, we further investigate the behavior regarding the temperature of the total Stark shift under SCC . As shown in the lower graph of Fig. 4, the magnitude increases as the temperature increases. Vis-a-vis the behavior exhibited by , the behavior concerning temperature would seem to be opposite to that expected since the magnitude is directly proportional to , which is in turn directly proportional to [see the last terms on the RHS of Eqs. (4) and (2) with ]. However, also depends on the parameter whose magnitude increases as the temperature increases, as shown in the middle graph of Fig. 4. Although contributes linearly to the magnitude, its growth rate with increasing temperature is strong enough to overcome the antagonistic rate of the quadratic contribution from . For this reason, the magnitude increases as temperature increases. The parameter , which can be determined by performing indirect measurements and applying Eq. (6), is physically a function of the out-of-plane effective masses () and the ground state energy shift enhancement factors (), due to the finite value of the barrier height, of electrons and heavy holes[12]. Consequently, in models where and are used explicitly instead of , it becomes essential that these parameters are a function of temperature. Otherwise, the change that the total Stark shift would undergo with temperature would be solely attributed to , and vice versa. If the Stark shift behavior were used to determine that of , then an erroneous comportment of , contrary to that found in this work, would be obtained. We speculate that the discrepancy between the piezoelectric constant behavior regarding temperature estimated in this work and that reported by other authors might be due to the omission of the temperature dependences of and electron (heavy hole) energy in the QWs, or an imprecise description of them, possibly because of the lack of detailed reports on these issues.
Finally, Fig. 2 shows that by varying the temperature from 18 to 28°C, the operation energy can be tuned 4 meV, and then, under OCC, fluctuating the input power from to 5 dBm, this resonance can be shifted 3.7 meV, as shown in Fig. 5. It is important to note that if the input signal were composed of pulses whose duration was less than the escape time of the carriers in the QWs plus the time it takes them to drain through the circuit formed by parasitic elements and the amplifier electrodes, then, under SCC, the power of each input pulse would also shift .
![]()
Figure 5.
This opens the possibility of devising ultra-fast all-optical applications using unbiased MQW-SOAs since there would be no free carriers that would generate slow tails in the falling edges of the output pulses as might occur under OCC, notably with high input powers. A study of the Stark effect dynamics under SCC and OCC is currently in progress.
4. Conclusion
We presented a procedure for determining the effective piezoelectric constant value of the [111]-oriented strained QWs of an MQW-SOA. Remarkably, the proposed method is insensitive to the temperature dependence of the bandgap energy and the segregation phenomenon. Likewise, it requires neither fitting parameters nor temperature-dependent expressions for energy and out-of-plane effective masses of electrons and heavy holes. When the procedure was applied to the MQW-SOA under study, a value of at 23°C was obtained. Unlike previously published methods, where the piezoelectric constant magnitude increased as the temperature rised without convincing explanation, we extracted an magnitude that decreased as temperature increased. Even though the method was specially designed for experimentally determining in MQW-SOAs, it can be applied to any p-iMQW-n structure with electrodes and strained [111]-oriented zinc-blende QWs. Finally, we found that by varying temperature, the operation energy could be tuned, and then, fluctuating the input power, this resonance could be significantly shifted. This enables the devising all-optical applications based on QCSE in unbiased MQW-SOAs. Thus, for example, the method can be applied to other MQW-SOAs, intended to implement all-optical functions based on the QCSE, to predict the shift of their with temperature, or to indirectly deduce how temperature will affect the undesirable effects that QCSE causes in some MQW LEDs.
References

Set citation alerts for the article
Please enter your email address
© Copyright 2018-2021 | Chinese Laser Press. All Rights Reserved 沪ICP备15018463号-20