
Ang-xin TONG, Xiao-jun TANG, Feng ZHANG, Bin WANG. Species Identification of NaCl, NaOH and β-Phenylethylamine Based on Ultraviolet Spectrophotometry and Supervised Pattern Recognition Technology[J]. Spectroscopy and Spectral Analysis, 2021, 41(2): 448
- Spectroscopy and Spectral Analysis
- Vol. 41, Issue 2, 448 (2021)

Fig. 1. Structure diagram of sample dilution
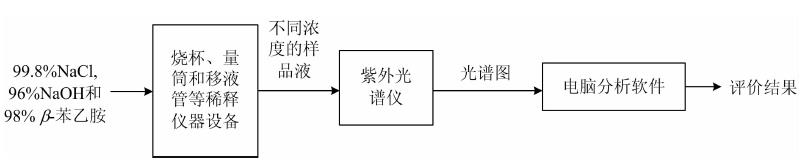
Fig. 2. Structure diagram of the equipment
Fig. 3. UV absorption spectra of NaCl, NaOH and PEA at 0.001 49 mol·L-1
Fig. 4. UV absorption spectra of the mixtures at seven different concentrations
Fig. 5. Distribution of score vector values in the space of the first three PCs
Fig. 6. Sample distribution of NaCl, NaOH and PEA in the plane of the discriminant functions
Fig. 7. Classification results of the mixture obtained by three supervised classification method
(a): RBF-SVM; (b): BP ANN; (c): ABC BP ANN; (a): RBF-SVM; (b): BP ANN; (c): ABC BP ANN; 1: 0%mol·L-1; 2: 10%mol·L-1; 3: 20%mol·L-1; 4: 30%mol·L-1; 5: 40%mol·L-1, 6: 50%mol·L-1; 7: 60%mol·L-1
(a): RBF-SVM; (b): BP ANN; (c): ABC BP ANN; (a): RBF-SVM; (b): BP ANN; (c): ABC BP ANN; 1: 0%mol·L-1; 2: 10%mol·L-1; 3: 20%mol·L-1; 4: 30%mol·L-1; 5: 40%mol·L-1, 6: 50%mol·L-1; 7: 60%mol·L-1
| |||||||||||||||||||||||||||||||||||||||||||||||||||||||||||||||||||||||
Table 1. The sensitivity and specificity of NaCl, NaOH and PEA for test sets obtained by supervised classification methods/%
| ||||||||||||||||||||||||||||||||||||||||||||||||||||||||||||||
Table 2. The sensitivity and specificity of the mixture for test sets obtained by three supervised classification methods

Set citation alerts for the article
Please enter your email address
© Copyright 2018-2021 | Chinese Laser Press. All Rights Reserved 沪ICP备15018463号-20