• Acta Optica Sinica
  • Vol. 41, Issue 3, 0310003 (2021)
Lingqin Kong, Fei Chen, Yuejin Zhao*, Liquan Dong, Ming Liu, and Mei Hui
Author Affiliations
  • Beijing Key Laboratory for Precision Optoelectronic Measurement Instrument and Technology, School of Optics and Photonics, Beijing Institute of Technology, Beijing 100081, China
  • show less
    DOI: 10.3788/AOS202141.0310003 Cite this Article Set citation alerts
    Lingqin Kong, Fei Chen, Yuejin Zhao, Liquan Dong, Ming Liu, Mei Hui. Non-Contact Psychological Stress Detection Combining Heart Rate Variability and Facial Expressions[J]. Acta Optica Sinica, 2021, 41(3): 0310003 Copy Citation Text show less
    Process of the establishing a psychological stress assessment model
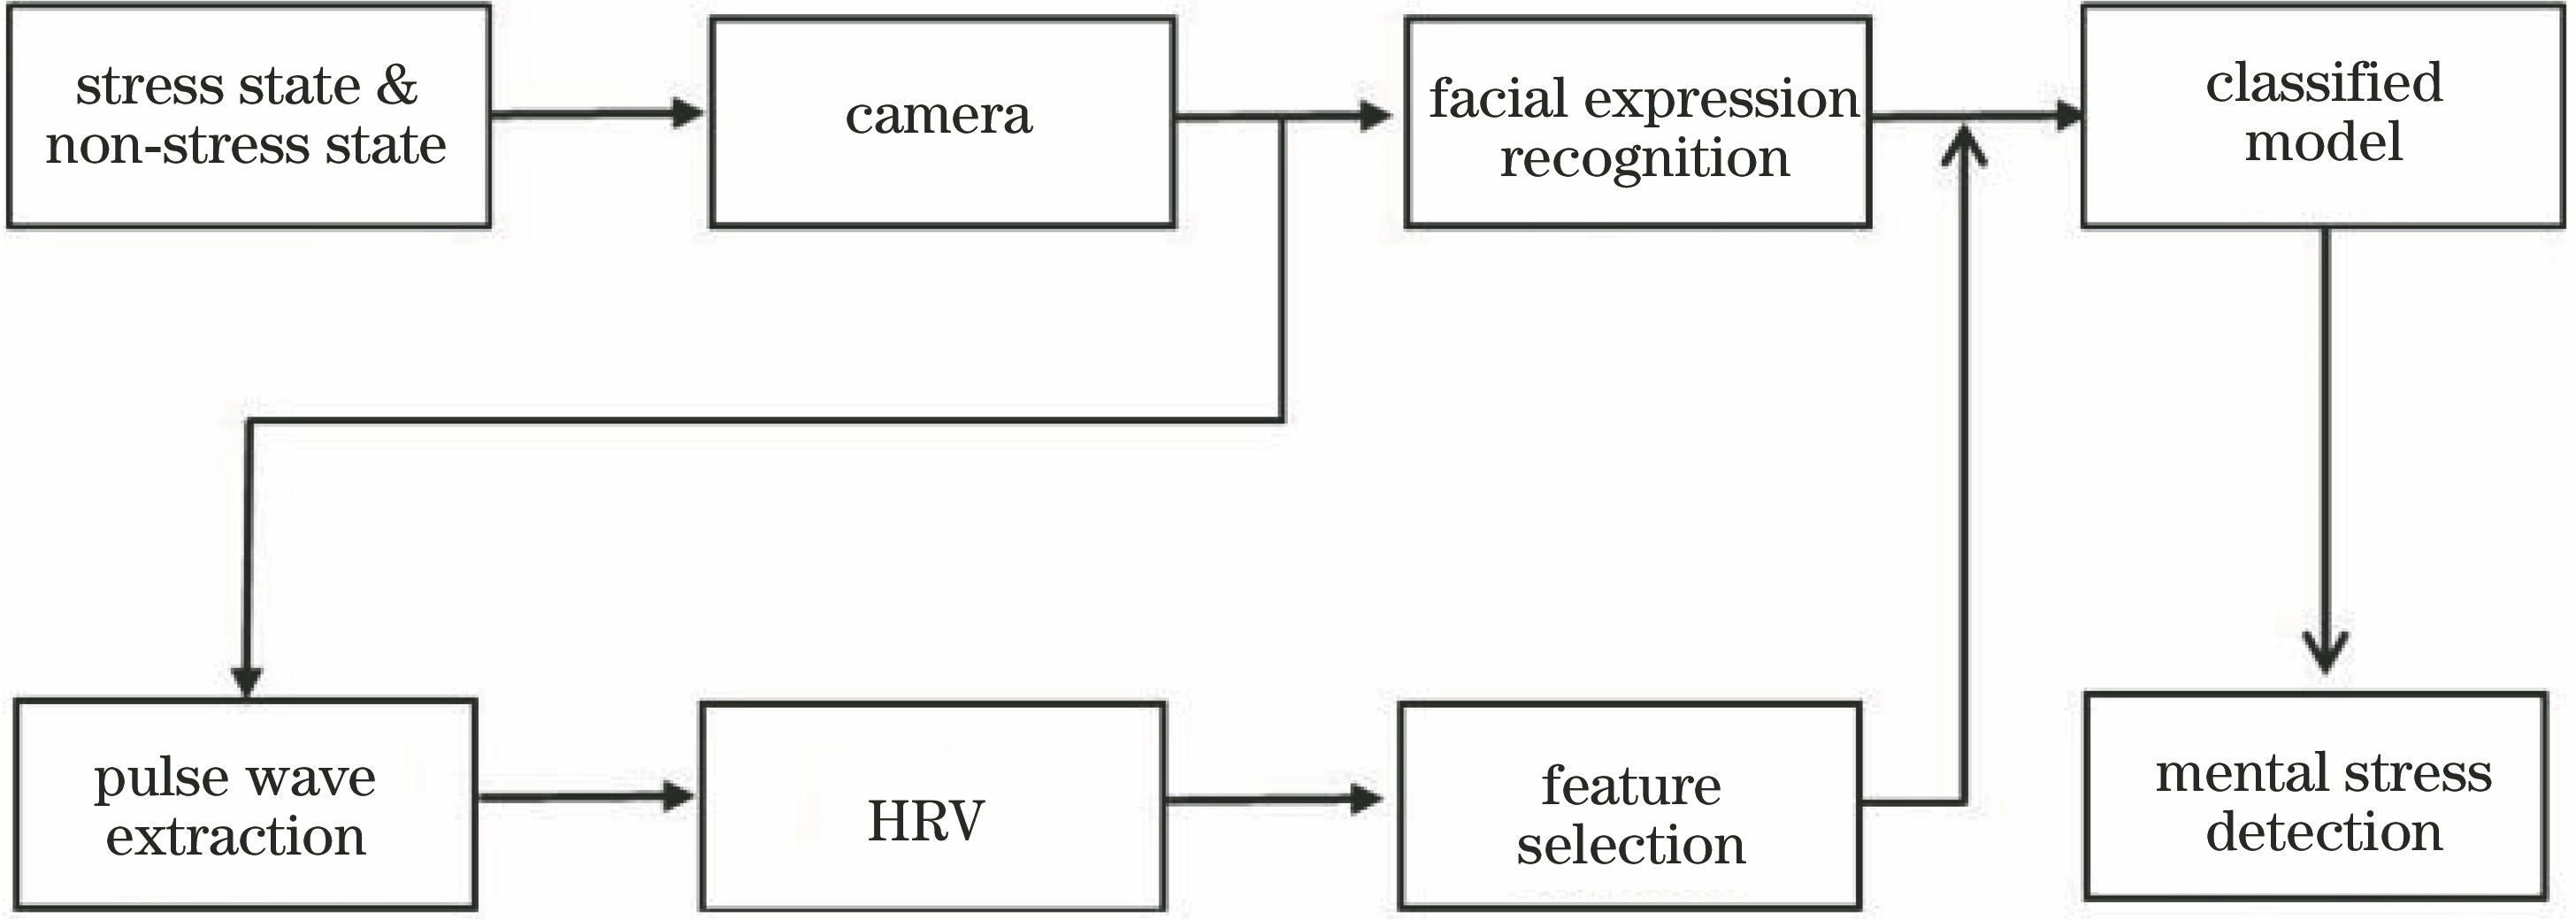
    Fig. 1. Process of the establishing a psychological stress assessment model
    Extraction flow chart of the non-contact HRV
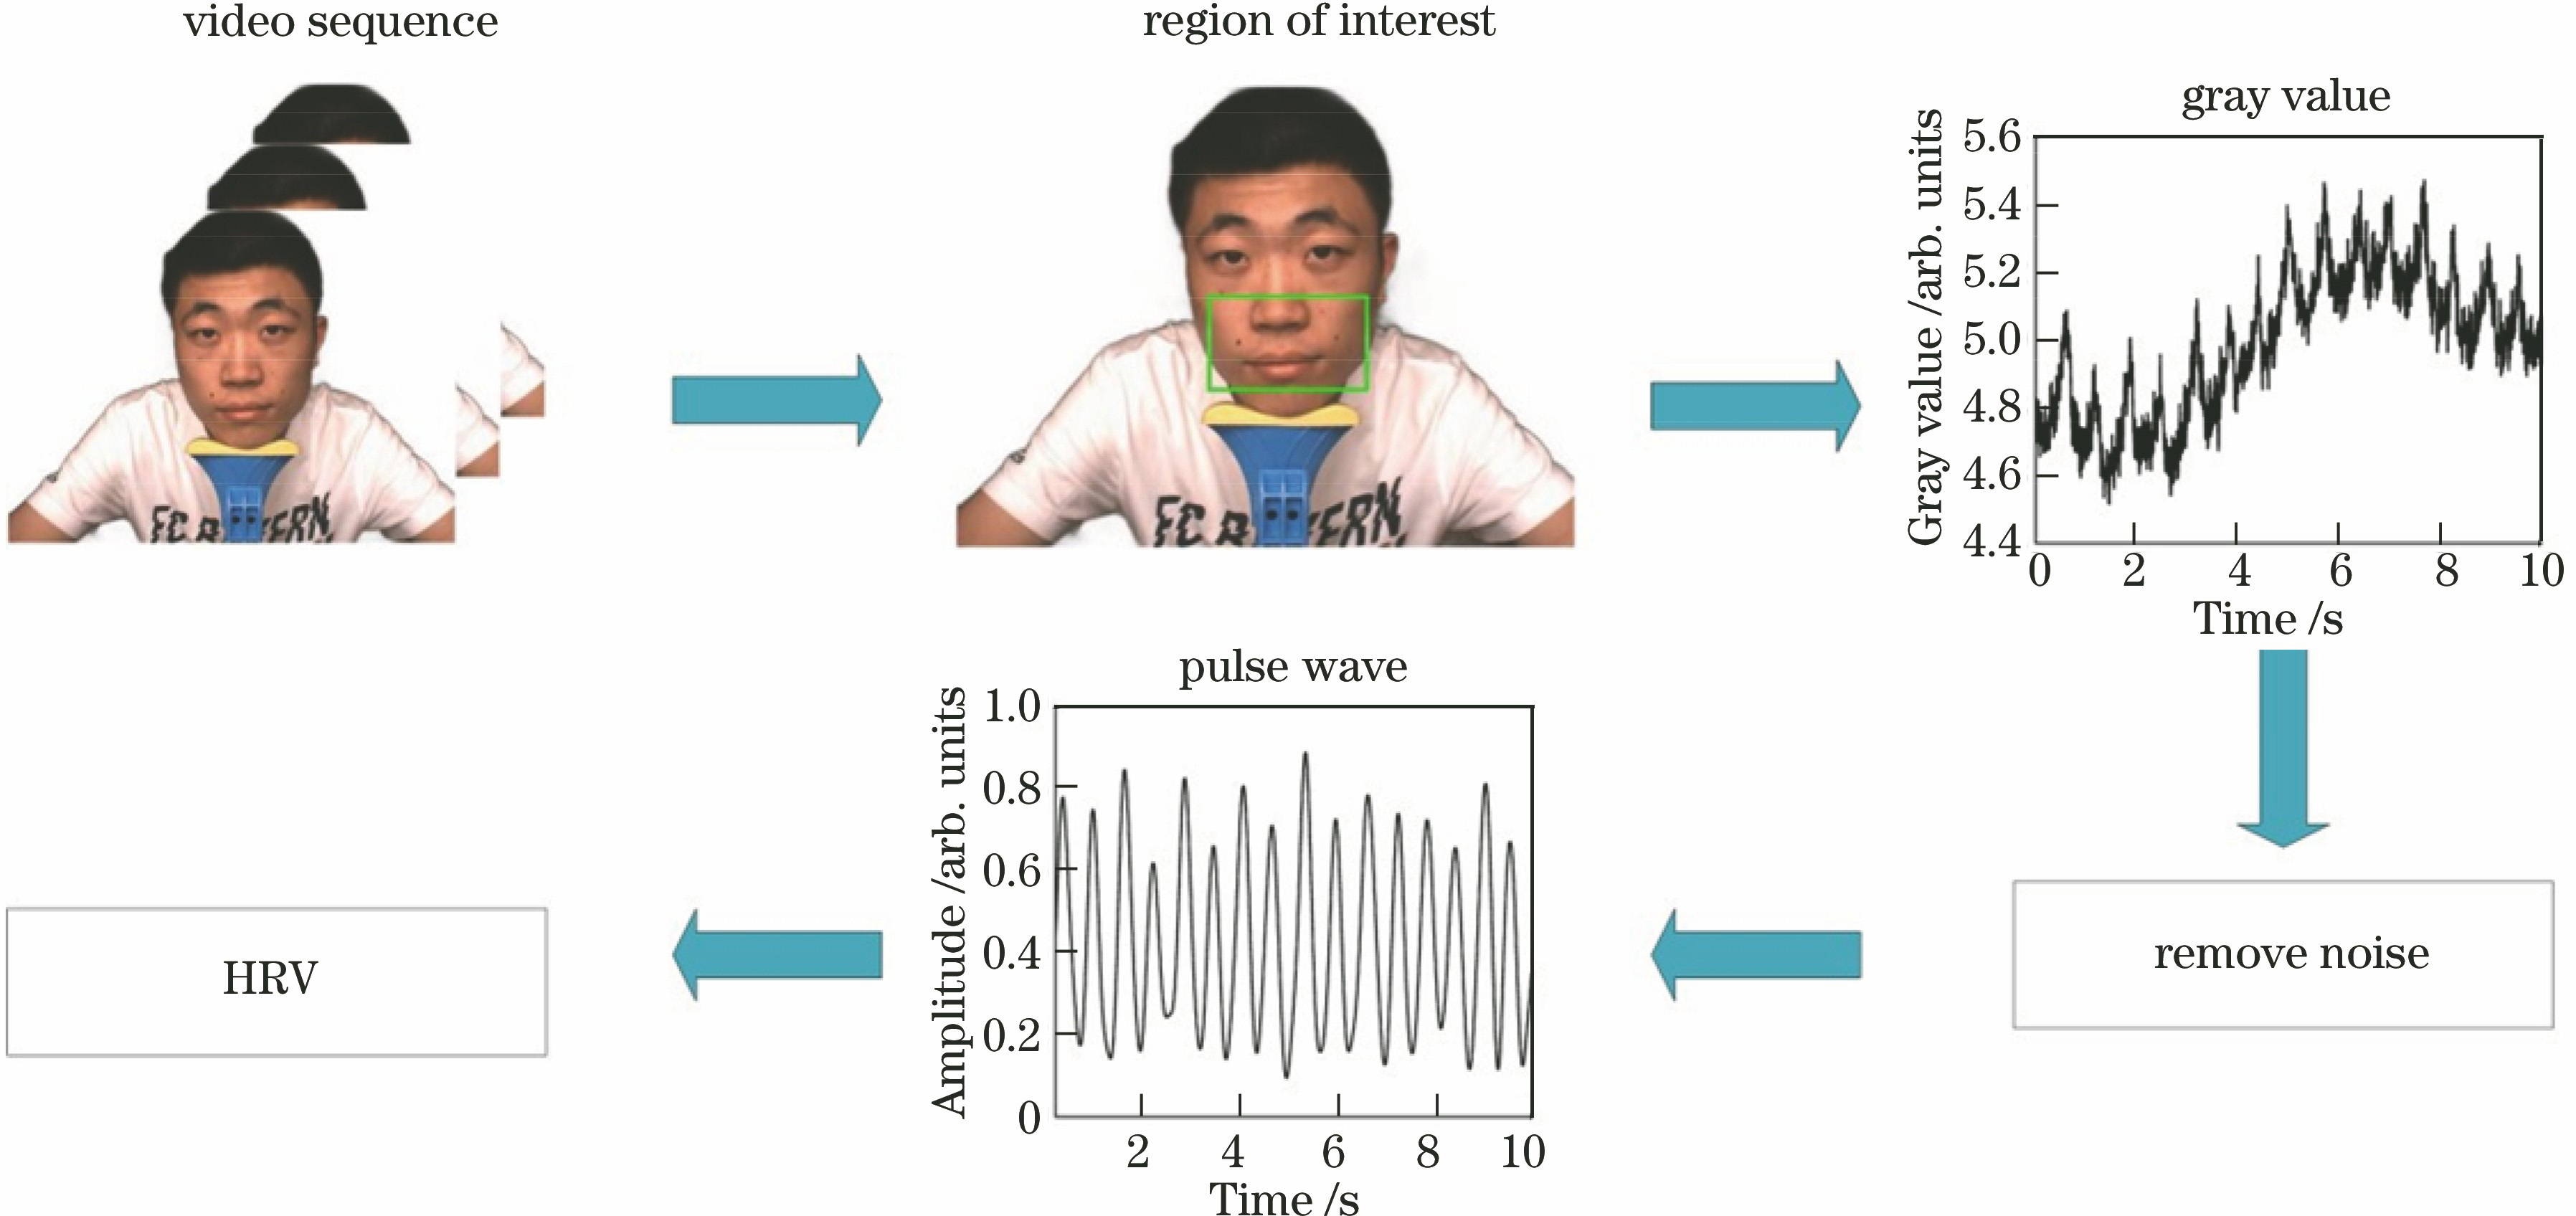
    Fig. 2. Extraction flow chart of the non-contact HRV
    Signal diagram during HRV extraction. (a) Mean gray value; (b) pulse wave signal after processing; (c) timing diagram of R-R interval
    Fig. 3. Signal diagram during HRV extraction. (a) Mean gray value; (b) pulse wave signal after processing; (c) timing diagram of R-R interval
    Diagram of the experimental setup
    Fig. 4. Diagram of the experimental setup
    Box plot of the HRV feature distribution. (a) Mean HR; (b) SDNN; (c) PNN50; (d) RMSSD; (e) NLF; (f) NHF; (g) XLF/XHF; (h) XSD2; (i) D2
    Fig. 5. Box plot of the HRV feature distribution. (a) Mean HR; (b) SDNN; (c) PNN50; (d) RMSSD; (e) NLF; (f) NHF; (g) XLF/XHF; (h) XSD2; (i) D2
    Box plot of the expression pressure value
    Fig. 6. Box plot of the expression pressure value
    IndexDefinitionUnitMeaning
    Mean HRthe average number ofheartbeats per minuteBPMreflect the heart beat rate
    PNN50the heart rate of adjacent R-R intervalsgreater than 50ms as a percentageof all NN intervals%reflect the activity ofparasympathetic nerve
    SDNNi=1N(XiRR-XRR-)2/(N-1)msreflect the level that the heart ratevariability deviates from the average
    RMSSDi=1N-1(Xi+1RR-XiRR)2N-1msmeasure the regulation effect ofparasympathetic nerve on heart rate
    Table 1. Time domain analysis indicators of the HRV
    IndexDefinitionUnitMeaning
    XVLFultra low frequency power (≤0.04 HZ)ms2related to body adjustment
    XLFlow frequency power(0.04--0.15 HZ)ms2reflect the activity of sympathetic nerve
    XHFhigh frequency power(0.15--0.4 HZ)ms2reflect the activity of parasympathetic nerve
    NLFNLF=XLFXTP-XVLF×100%%standardized low frequency power,direct response to the activity ofsympathetic nerve.TP:total power
    NHFNHF=XHFXTP-XVLF×100%%standardized high frequency power,direct response to the activity ofparasympathetic nerve.TP:total power
    XLF/XHFpower ratio of low frequencyband to high frequency band-reflect the balance of sympatheticand parasympathetic nerves
    PVLFpeak point of ultra low frequency powerHz-
    PLFpeak point of low frequency powerHz-
    PHFpeak point of high frequency powerHz-
    Table 2. Frequency domain analysis indicators of the HRV
    IndexDefinitionUnitMeaning
    XSD1the standard deviation of thevertical line in the Poincaré chartmsrelated to sympathetic nerve activity
    XSD2the standard deviation along themarked line in the Poincaré chartmsrelated to parasympathetic nerve activity
    D2correlation dimension-reflect the heart's ability toadapt to the environment
    α1short-term volatility slope in trend volatility analysis--
    α2long-term volatility slope in trend volatility analysis--
    Table 3. Non-linear analysis indicators of the HRV
    NameNormalStress
    Mean HR /BPM78.23184.421
    PNN50 /%33.88229.164
    SDNN /ms52.03446.424
    RMSSD /ms38.62333.862
    XVLF /ms252.31742.347
    XLF /ms2375.427327.135
    XHF /ms2961.326613.463
    NLF /%28.08534.779
    NHF /%71.91565.221
    XLF/XHF0.4170.541
    PVLF /Hz0.0390.039
    PLF /Hz0.1100.117
    PHF /Hz0.2850.297
    XSD1 /ms38.45737.837
    XSD2 /ms41.62631.976
    D23.5412.036
    α10.6680.636
    α20.2200.236
    Table 4. Results of the HRV
    ModelKernel typeGammaCAccuracy /%
    SVMGaussiankernel function0.0026.67981.4
    Table 5. Results of training using HRV and facial expressions
    MethodAccuracy
    HRV feature in Ref. [10]65.1
    HRV feature in ours73.9
    Expression71.9
    HRV & Expression81.4
    Table 6. Results of the comparative experimentsunit: %
    Lingqin Kong, Fei Chen, Yuejin Zhao, Liquan Dong, Ming Liu, Mei Hui. Non-Contact Psychological Stress Detection Combining Heart Rate Variability and Facial Expressions[J]. Acta Optica Sinica, 2021, 41(3): 0310003
    Download Citation