
Lingxiao Fu, Guangfeng Chen, Ge Chen. An Edge Detection Algorithm Applied to Setting Machine[J]. Laser & Optoelectronics Progress, 2018, 55(11): 111506
- Laser & Optoelectronics Progress
- Vol. 55, Issue 11, 111506 (2018)
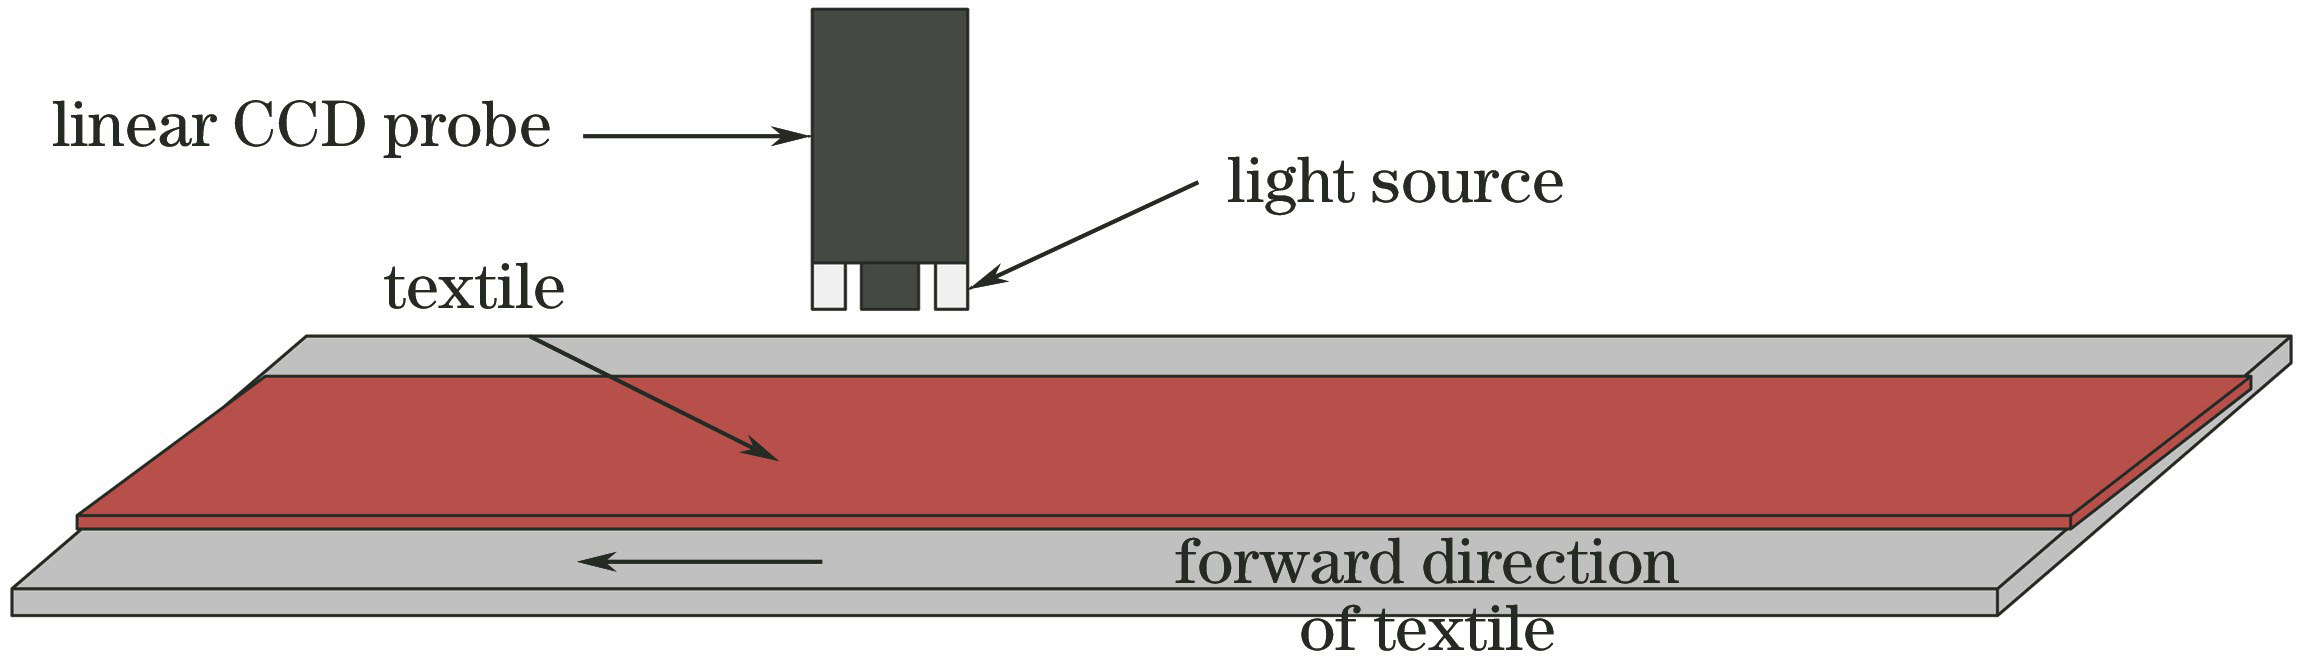
Fig. 1. Sketch of the edge detection system
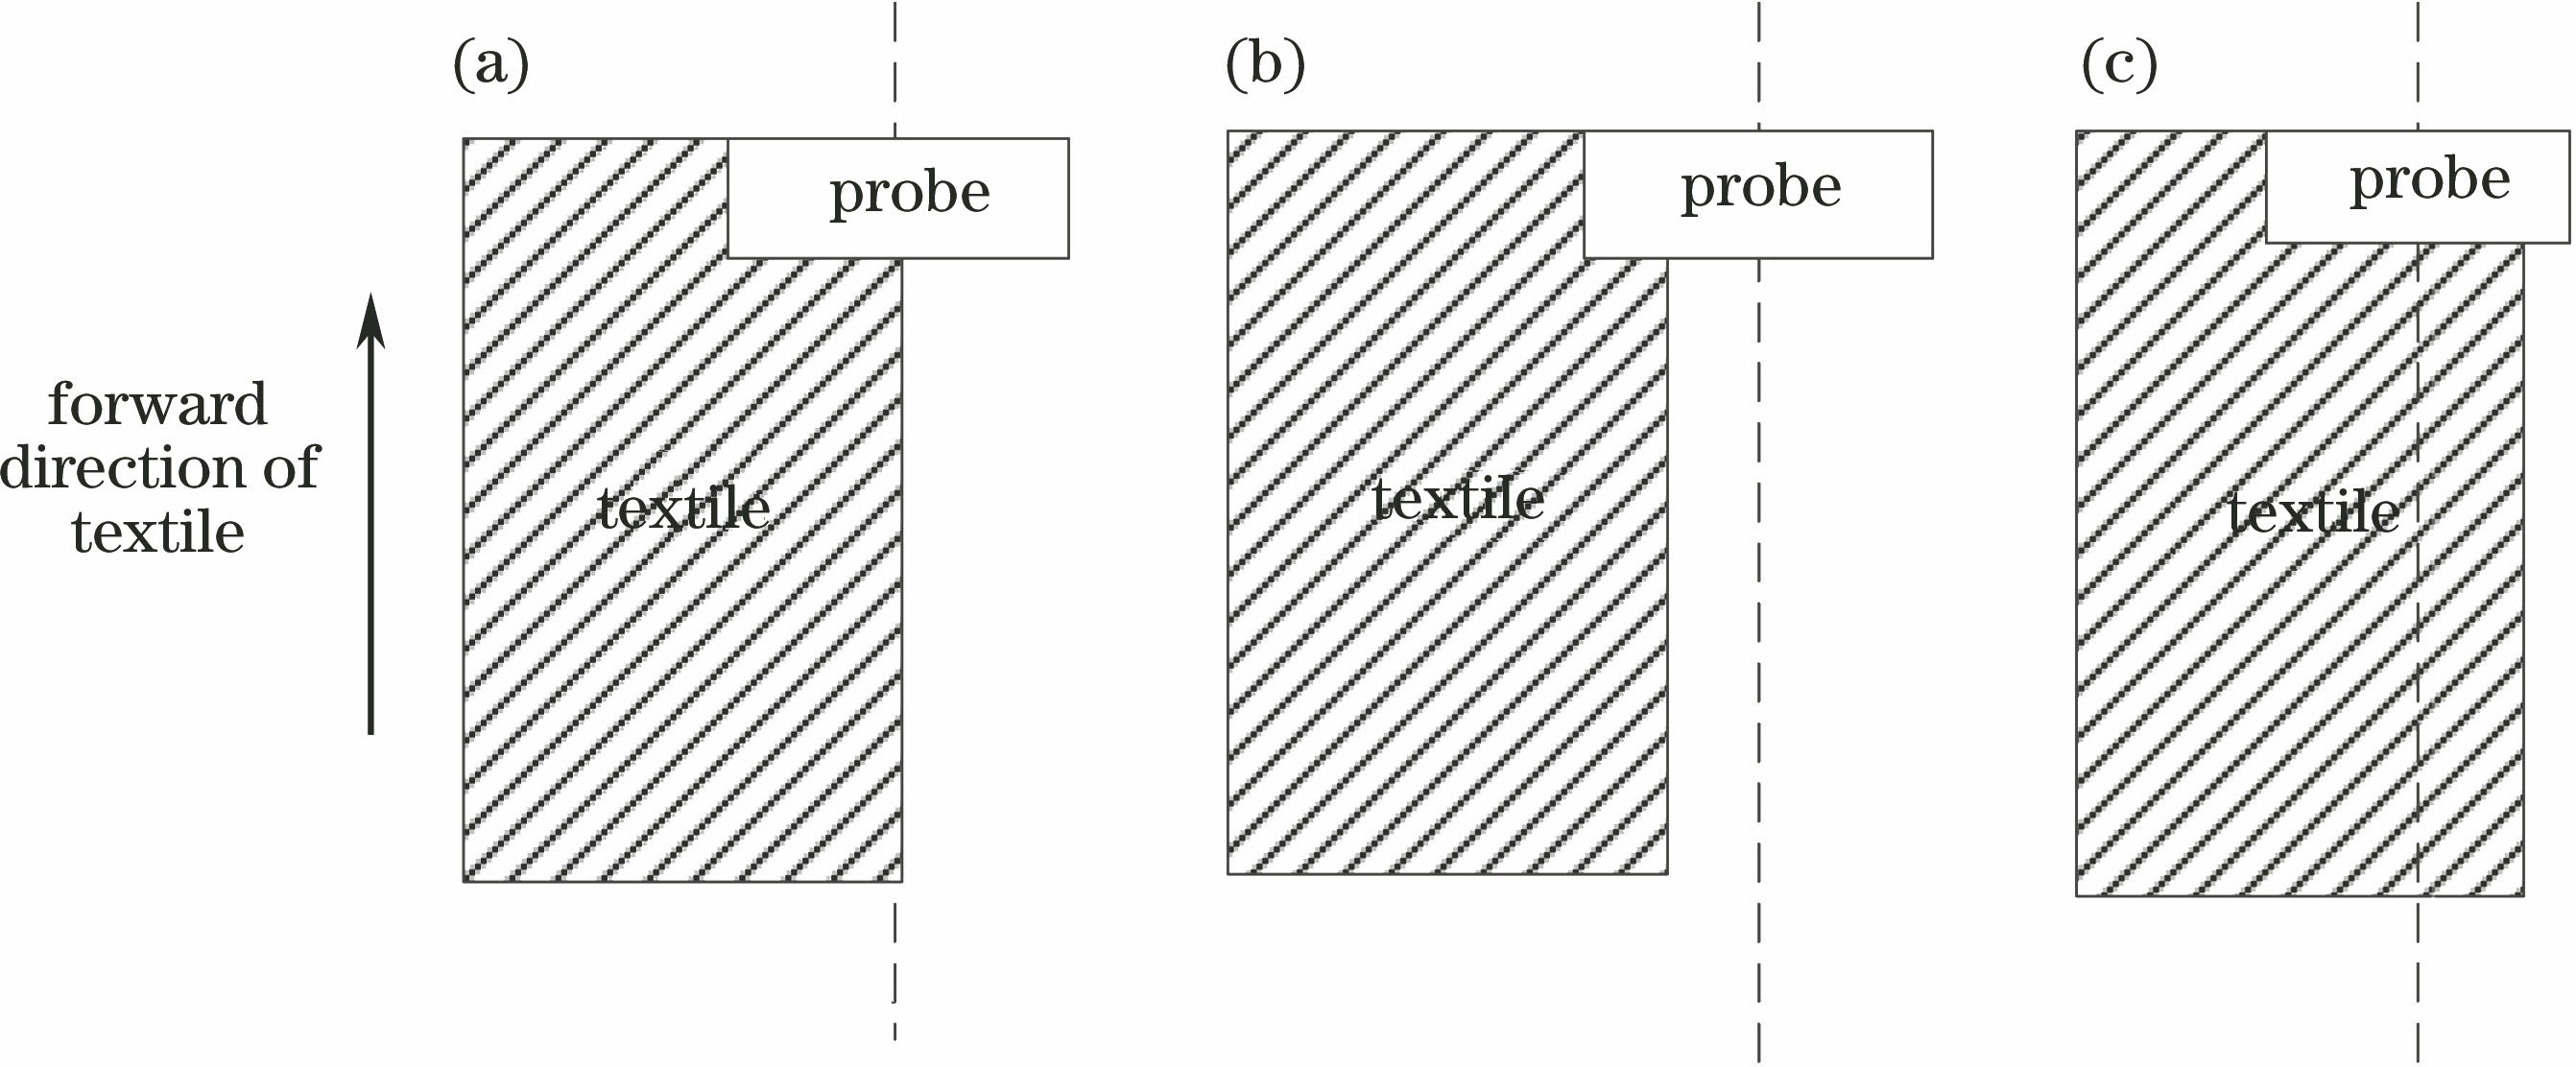
Fig. 2. Top view of probe and moving textile. (a) Normal position; (b) left shift; (c) right shift
Fig. 3. Flow chart of detecting edge
Fig. 4. Pixel distribution
Fig. 5. Original image
Fig. 6. Gray scale response curve of textile and background
Fig. 7. Grayscale response curve with only edge information
Fig. 8. Flow chart for solving edge starting point xk
Fig. 9. Flow chart for solving edge terminating point xj
Fig. 10. Experimental platform
Fig. 11. Creamy white carpet edge detection result. (a) Original grayscale; (b) after median filtering; (c) after algorithm post-processing
Fig. 13. Edge detection result of dark gray cotton cloth with hollowed-out and white stripes. (a) Original grayscale; (b) after median filtering; (c) after algorithm post-processing
Fig. 14. Edge detection result of dark gray cotton cloth with hollowed-out and white stripes in a light gray background. (a) Original grayscale; (b) after median filtering; (c) after algorithm post-processing
Fig. 15. Contrast among OTSU algorithm, lattice Boltzmann algorithm, and designed algorithm for edge detection. (a) Original grayscale; (b) after median filtering; (c) after OTSU algorithm post-processing; (d) after lattice Boltzmann algorithm post-processing; (e) after designed algorithm post-processing
|
Table 1. Experimental parameters of environment platform
|
Table 2. Filtering data of 5×1, 7×1, and 9×1 templates
|
Table 3. High and low gray response fabric edge detection data
|
Table 4. Edge detection data of dark gray cotton cloth with hollowed-out and white stripes
|
Table 5. Edge detection data for different background colors
|
Table 6. Edge detection data of different algorithms

Set citation alerts for the article
Please enter your email address
© Copyright 2018-2021 | Chinese Laser Press. All Rights Reserved 沪ICP备15018463号-20