• Acta Optica Sinica
  • Vol. 38, Issue 11, 1126001 (2018)
Shuang Chen1、3、4、*, Gaofang Yin1、4, Nanjing Zhao1、4、*, Zhisong Qin2, Xiaoling Zhang1、4, Tingting Gan1、4, Jianguo Liu1、4, and Wenqing Liu1、4
Author Affiliations
  • 1 Key Laboratory of Environmental Optics and Technology, Anhui Institute of Optics and Fine Mechanics, Chinese Academy of Sciences, Hefei, Anhui 230031, China
  • 2 School of Computer Science and Information Security, Guilin University of Electronic Technology, Guilin, Guangxi 541004, China
  • 3 School of Environmental Science and Optoelectronics, University of Science and Technology of China, Hefei, Anhui 230026, China
  • 4 Key Laboratory of Optical Monitoring Technology for Environment, Anhui Province, Hefei, Anhui 230031, China
  • show less
    DOI: 10.3788/AOS201838.1126001 Cite this Article Set citation alerts
    Shuang Chen, Gaofang Yin, Nanjing Zhao, Zhisong Qin, Xiaoling Zhang, Tingting Gan, Jianguo Liu, Wenqing Liu. Measurement of Primary Productivity of Phytoplankton Based on Photosynthetic Electron Transport Rate[J]. Acta Optica Sinica, 2018, 38(11): 1126001 Copy Citation Text show less
    Energy flow process of photosynthesis of phytoplankton
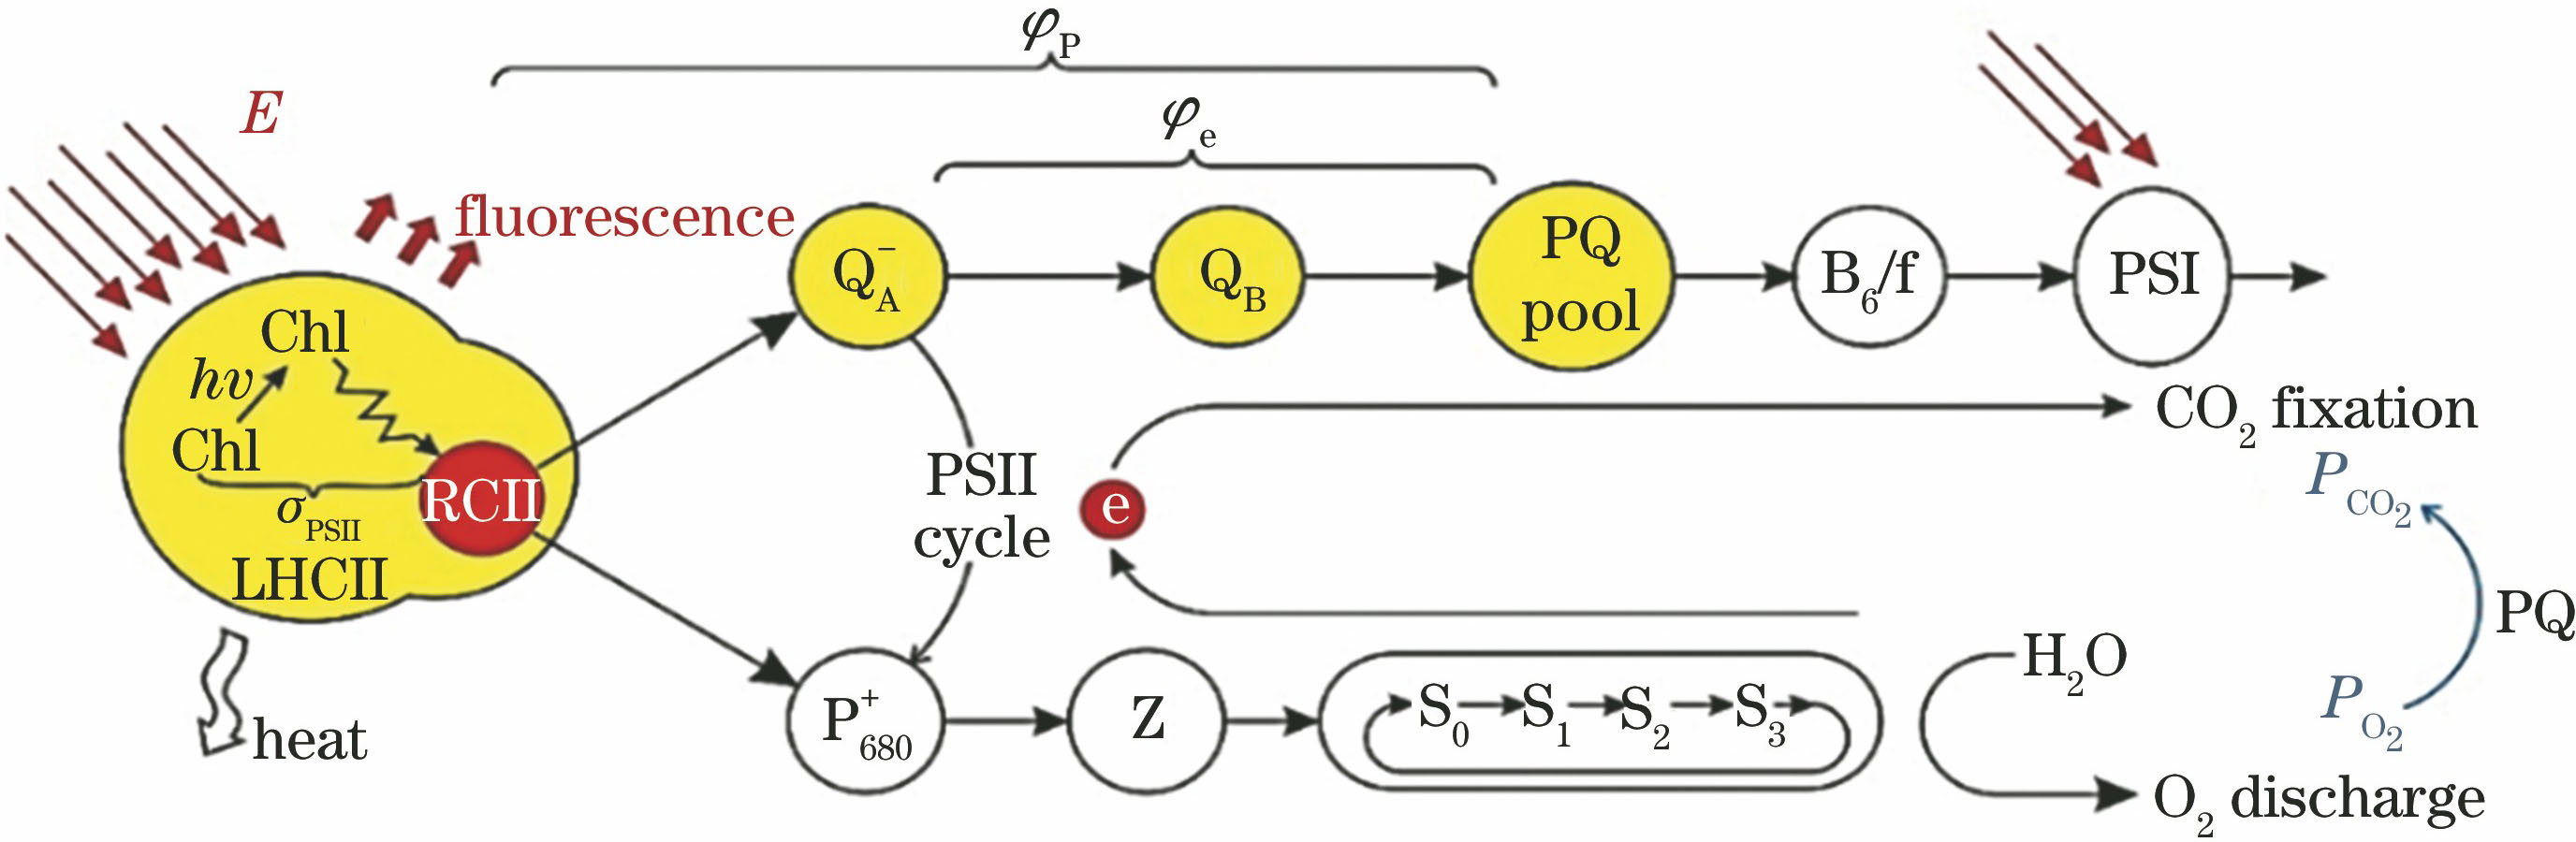
    Fig. 1. Energy flow process of photosynthesis of phytoplankton
    Fluorescence kinetic curve inversion of fluorescence parameters
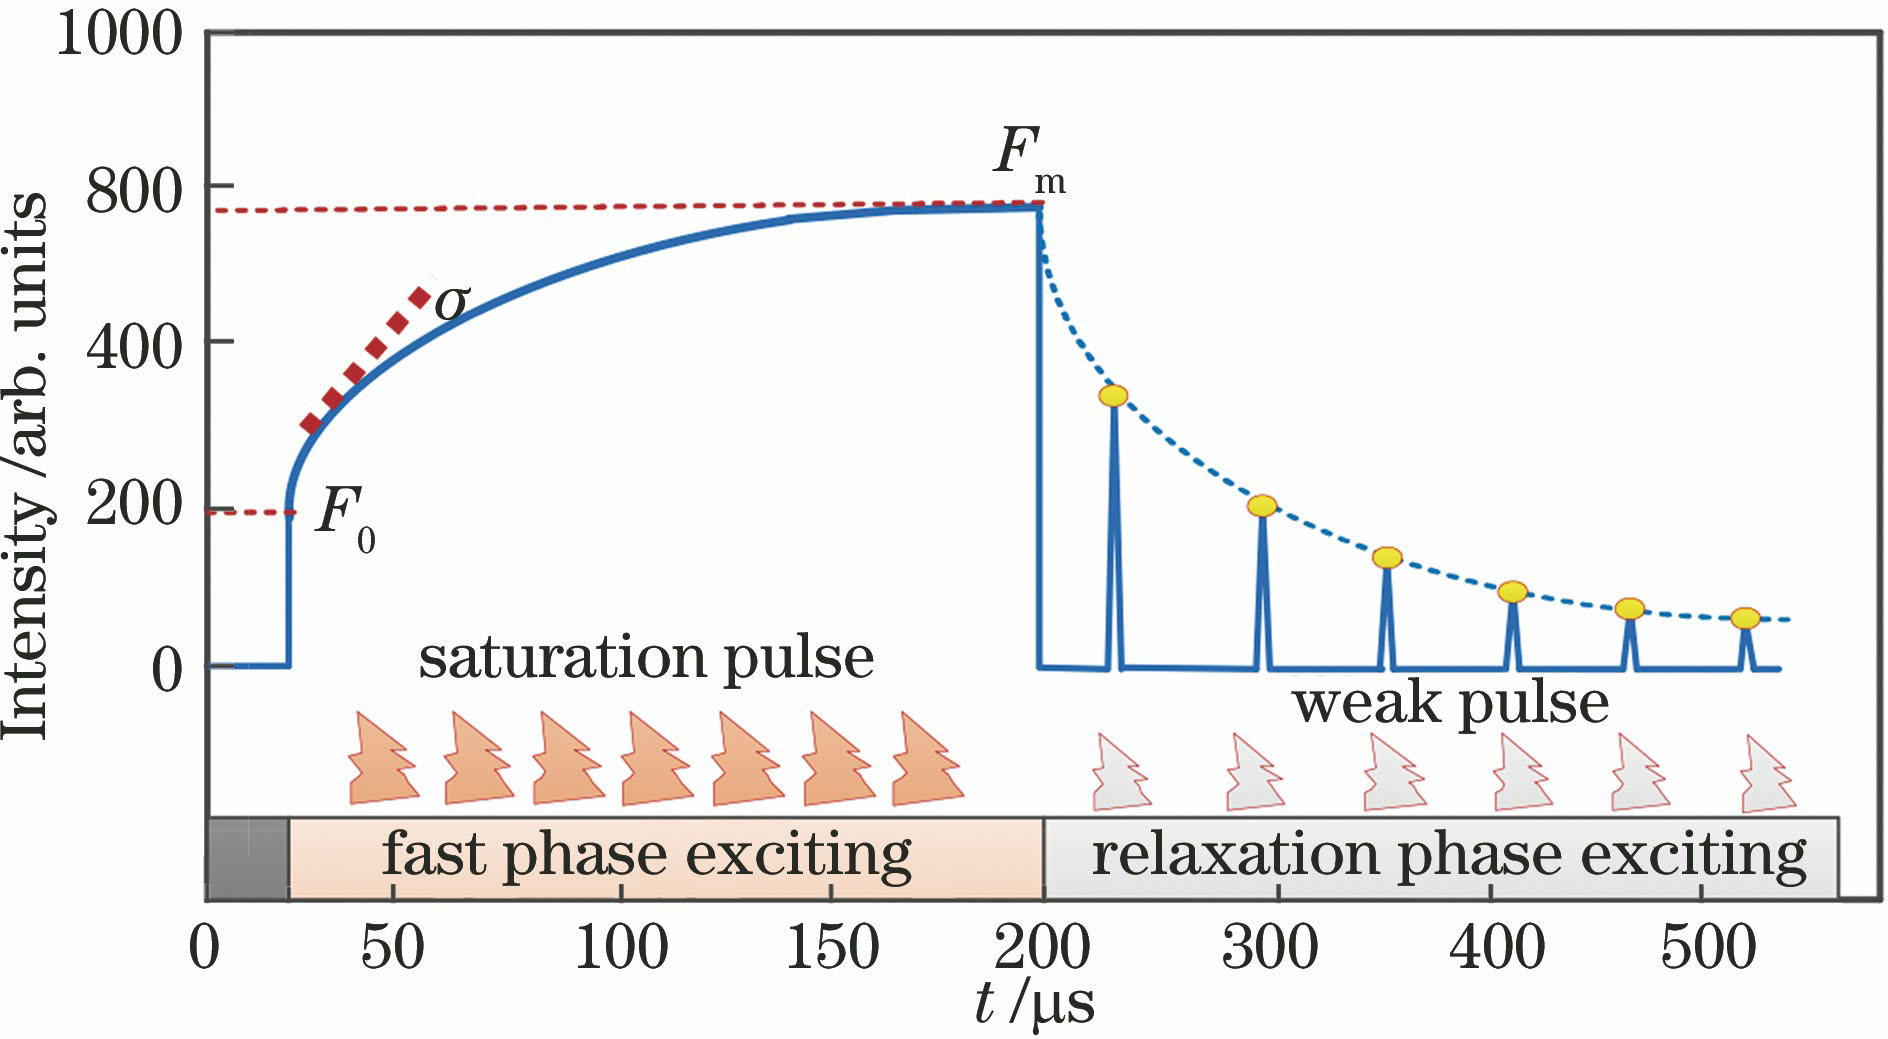
    Fig. 2. Fluorescence kinetic curve inversion of fluorescence parameters
    (a) Photosynthetic oxygen release amount and (b) photosynthetic oxygen release rate of phytoplankton measured by oxygen electrode method
    Fig. 3. (a) Photosynthetic oxygen release amount and (b) photosynthetic oxygen release rate of phytoplankton measured by oxygen electrode method
    Measurement results of photosynthetic electron transport rate Pe and photosynthetic oxygen release rate PO2 of chlorella pyrenoidosa at stress of DCMU. (a) Variation of PO2 with ambient light intensity; (b) variation of Pe with ambient light intensity; (c) variations of PO2 and Pe with DCMU stress concentration; (d) linear relationship between PO2 and Pe
    Fig. 4. Measurement results of photosynthetic electron transport rate Pe and photosynthetic oxygen release rate PO2 of chlorella pyrenoidosa at stress of DCMU. (a) Variation of PO2 with ambient light intensity; (b) variation of Pe with ambient light intensity; (c) variations of PO2 and Pe with DCMU stress concentration; (d) linear relationship between PO2 and Pe
    Measurement results of photosynthetic electron transport rate Pe and photosynthetic oxygen release rate PO2 of chlorella pyrenoidosa at stress of nitrogen. (a) Variation of PO2 with ambient light intensity; (b) variation of Pe with ambient light intensity; (c) variations of PO2 and Pe with nitrogen stress concentration; (d) linear relationship between PO2 and Pe
    Fig. 5. Measurement results of photosynthetic electron transport rate Pe and photosynthetic oxygen release rate PO2 of chlorella pyrenoidosa at stress of nitrogen. (a) Variation of PO2 with ambient light intensity; (b) variation of Pe with ambient light intensity; (c) variations of PO2 and Pe with nitrogen stress concentration; (d) linear relationship between PO2 and Pe
    Measurement results of photosynthetic electron transport rate Pe and photosynthetic oxygen release rate PO2 of chlorella pyrenoidosa at stress of cultivation light intensity. (a) Variation of PO2 with ambient light intensity; (b) variation of Pe with ambient light intensity; (c) variation of PO2 and Pe with cultivation light intensity; (d) linear relationship between PO2 and Pe
    Fig. 6. Measurement results of photosynthetic electron transport rate Pe and photosynthetic oxygen release rate PO2 of chlorella pyrenoidosa at stress of cultivation light intensity. (a) Variation of PO2 with ambient light intensity; (b) variation of Pe with ambient light intensity; (c) variation of PO2 and Pe with cultivation light intensity; (d) linear relationship between PO2 and Pe
    Experimental typeInitial mass concentration /(μg·L-1)Stress factorStress timeStress condition
    Activity inhibition1155DCMU10 min0,30,50,80,100 μmol·L-1
    Growth inhibition600Light intensity15 d30,60,150,200,300,700 μmol·m-2·s-1
    450Nitrogen15 d8,16,32,64,128,228,512 mg·L-1
    Table 1. Stress experimental condition setting
    Shuang Chen, Gaofang Yin, Nanjing Zhao, Zhisong Qin, Xiaoling Zhang, Tingting Gan, Jianguo Liu, Wenqing Liu. Measurement of Primary Productivity of Phytoplankton Based on Photosynthetic Electron Transport Rate[J]. Acta Optica Sinica, 2018, 38(11): 1126001
    Download Citation