
Zhi-qi ZHANG, Tong ZHAO, Ling LIU, Yan LI. Spectral Characteristics of Madagascar Agates[J]. Spectroscopy and Spectral Analysis, 2021, 41(10): 3227
- Spectroscopy and Spectral Analysis
- Vol. 41, Issue 10, 3227 (2021)
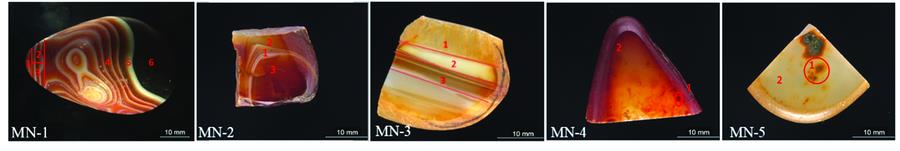
Fig. 1. Samples of Madagascar agates
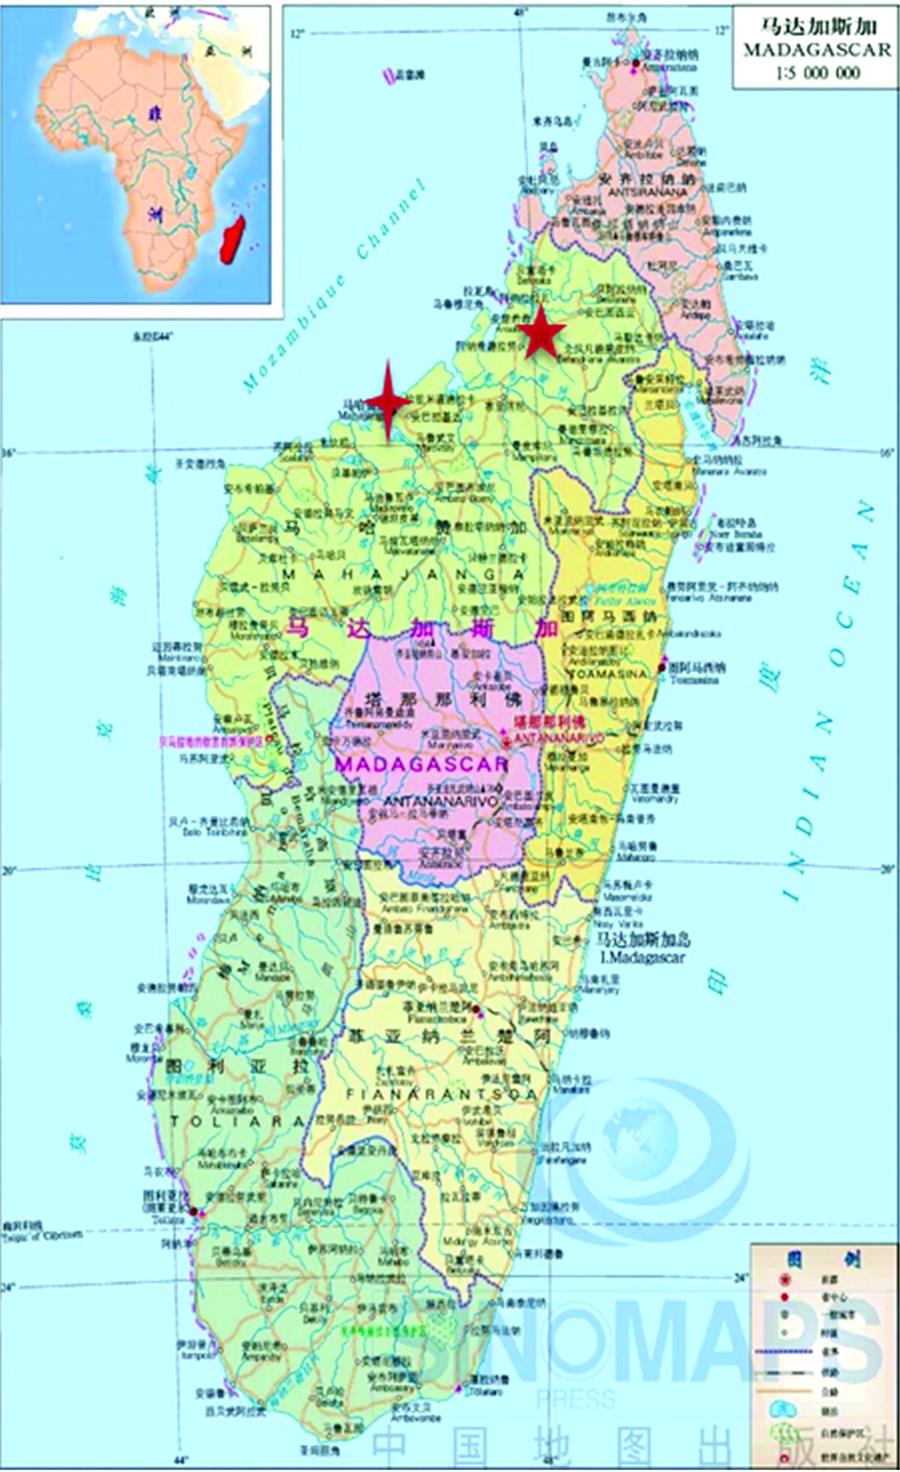
Fig. 2. A map of Madagascar
Mahajanga and Antsohihy are labelled by quadrangular star and pentagram respectively
Mahajanga and Antsohihy are labelled by quadrangular star and pentagram respectively
Fig. 3. Concentric circular strips observed at site 1 of MN-1 sample
(a): Under plane polarized light;(b): Under crossed polarized light
(a): Under plane polarized light;(b): Under crossed polarized light
Fig. 4. (a), (b) are images of MN-1 at 100× magnification; (c), (d) are images of MN-1 at 200× magnification; (e) distribution of some quartz species at the site coloured by red and white of sample MN-1
(a), (c): Under plane polarized light;(b), (d): Under crossed polarized light
(a), (c): Under plane polarized light;(b), (d): Under crossed polarized light
Fig. 5. (a) Infrared spectra of sample MN-1 (the red stripe, the white stripe, the brown area); (b) Infrared spectra of sample MN-3 (the brownish yellow parallel stripe, the white parallel stripe, the yellow area)
Fig. 6. Raman spectra of the white stripes in MN-1, MN-2 and MN-3
Fig. 7. (a) Raman spectra of colored stripes in MN-1, MN-2 and MN-3 and red spots in MN-4; (b) Raman spectra of colored areas in MN-1—MN-5
Fig. 8. The Raman spectra of an inclusion in MN-3 (a); the Raman spectra of the yellow inclusion in MN-5 (b)
Fig. 9. The genetic mechanism of agates from Madagascar
|
Table 1. Raman shift peaks of quartz, moganite and FeO(OH)

Set citation alerts for the article
Please enter your email address
© Copyright 2018-2021 | Chinese Laser Press. All Rights Reserved 沪ICP备15018463号-20