• Chinese Optics Letters
  • Vol. 15, Issue 8, 081103 (2017)
Jaeho Choi1、* and Young-Sung Park1、2
Author Affiliations
  • 1Department of Physics, Dankook University, Cheonan 31116, Korea
  • 2Division of RI Convergence Research, Korea Institute of Radiological and Medical Sciences, Seoul 01812, Korea
  • show less
    DOI: 10.3788/COL201715.081103 Cite this Article Set citation alerts
    Jaeho Choi, Young-Sung Park. Enhanced quantitative X-ray phase-contrast images using Foucault differential filters[J]. Chinese Optics Letters, 2017, 15(8): 081103 Copy Citation Text show less
    (Color online) Schematic diagram of the FDF method. S, X-ray tube source; A, lead aperture; SC, scintillation crystal; IO, visible light imaging optics; SP, specimen; f, focal length of PA; g, distance between the end of the specimen surface and the FKAF; blue arrow, translation direction of SP. k1, k2, k3, knife edges; z axis, optical axis.
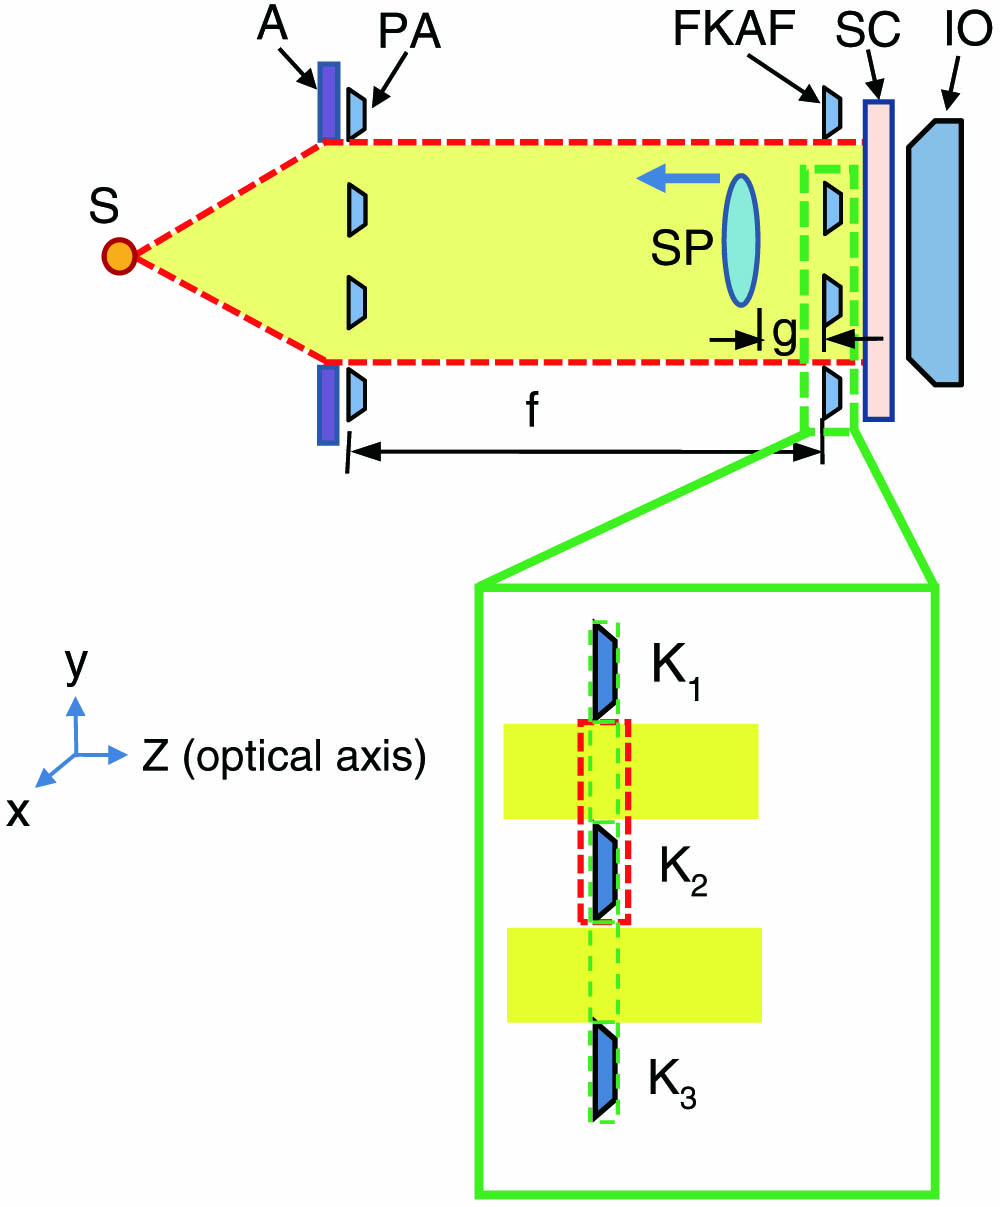
    Fig. 1. (Color online) Schematic diagram of the FDF method. S, X-ray tube source; A, lead aperture; SC, scintillation crystal; IO, visible light imaging optics; SP, specimen; f, focal length of PA; g, distance between the end of the specimen surface and the FKAF; blue arrow, translation direction of SP. k1, k2, k3, knife edges; z axis, optical axis.
    Schematic of an example for the scan process to acquire FDF data in the xy plane by a knife-edge element k2.
    Fig. 2. Schematic of an example for the scan process to acquire FDF data in the xy plane by a knife-edge element k2.
    Illustration of the concept of imaging the different surfaces using the FKA with optical axis translation of the specimen, s1–s4, surfaces in the specimen; t1–t4, transmitted X-rays; r1–r4, refracted X-rays.
    Fig. 3. Illustration of the concept of imaging the different surfaces using the FKA with optical axis translation of the specimen, s1s4, surfaces in the specimen; t1t4, transmitted X-rays; r1r4, refracted X-rays.
    Sequential QXPC images, where z represents the specimen position along the optical axis. The initial distance (z= 0) from the end surface of the specimen to the FKAF (g in Fig. 1) was ∼1 mm.
    Fig. 4. Sequential QXPC images, where z represents the specimen position along the optical axis. The initial distance (z=0) from the end surface of the specimen to the FKAF (g in Fig. 1) was 1mm.
    (Color online) (a) Surface rendering image is depicted, using the stacked images of the QXPC. (b) ROI of a region of the upper Pc. Cross-sectional cut lines (red dots) rotated to x=76°, y=45°, and z=10° from their original axes. (c) Cross-sectional images along the cut lines. The arrow-heads at the cut lines on (c) represent the corresponding spots on the sliced planes on (c). The color bar expresses the relative intensity relevant to the density of the medium. Reddish and blue colors imply high- and low-density mediums, respectively.
    Fig. 5. (Color online) (a) Surface rendering image is depicted, using the stacked images of the QXPC. (b) ROI of a region of the upper Pc. Cross-sectional cut lines (red dots) rotated to x=76°, y=45°, and z=10° from their original axes. (c) Cross-sectional images along the cut lines. The arrow-heads at the cut lines on (c) represent the corresponding spots on the sliced planes on (c). The color bar expresses the relative intensity relevant to the density of the medium. Reddish and blue colors imply high- and low-density mediums, respectively.
    Jaeho Choi, Young-Sung Park. Enhanced quantitative X-ray phase-contrast images using Foucault differential filters[J]. Chinese Optics Letters, 2017, 15(8): 081103
    Download Citation