• Spectroscopy and Spectral Analysis
  • Vol. 42, Issue 11, 3552 (2022)
Hong-jun LIU1、*, Teng NIU1、1;, Qiang YU1、1; *;, Kai SU2、2;, Lin-zhe YANG1、1;, Wei LIU1、1;, and Hui-yuan WANG1、1;
Author Affiliations
  • 11. College of Forestry, Beijing Forestry University, Beijing 100083, China
  • 22. Forestry College, Guangxi University, Nanning 530005, China
  • show less
    DOI: 10.3964/j.issn.1000-0593(2022)11-3552-07 Cite this Article
    Hong-jun LIU, Teng NIU, Qiang YU, Kai SU, Lin-zhe YANG, Wei LIU, Hui-yuan WANG. Inversion and Estimation of Heavy Metal Element Content in Peach Forest Soil in Pinggu District of Beijing[J]. Spectroscopy and Spectral Analysis, 2022, 42(11): 3552 Copy Citation Text show less
    Overview of the study area and distribution location of sampling points
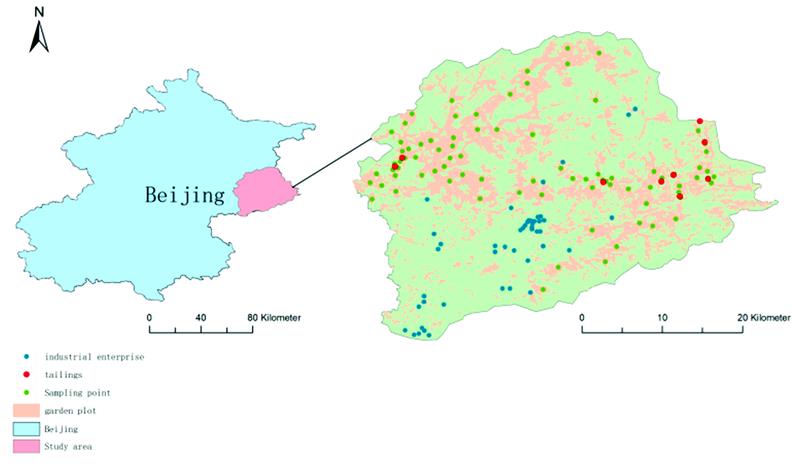
    Fig. 1. Overview of the study area and distribution location of sampling points
    Reflectance spectra (a) and first derivative transformation (b) of leaves under heavy metal stress and normal leaves
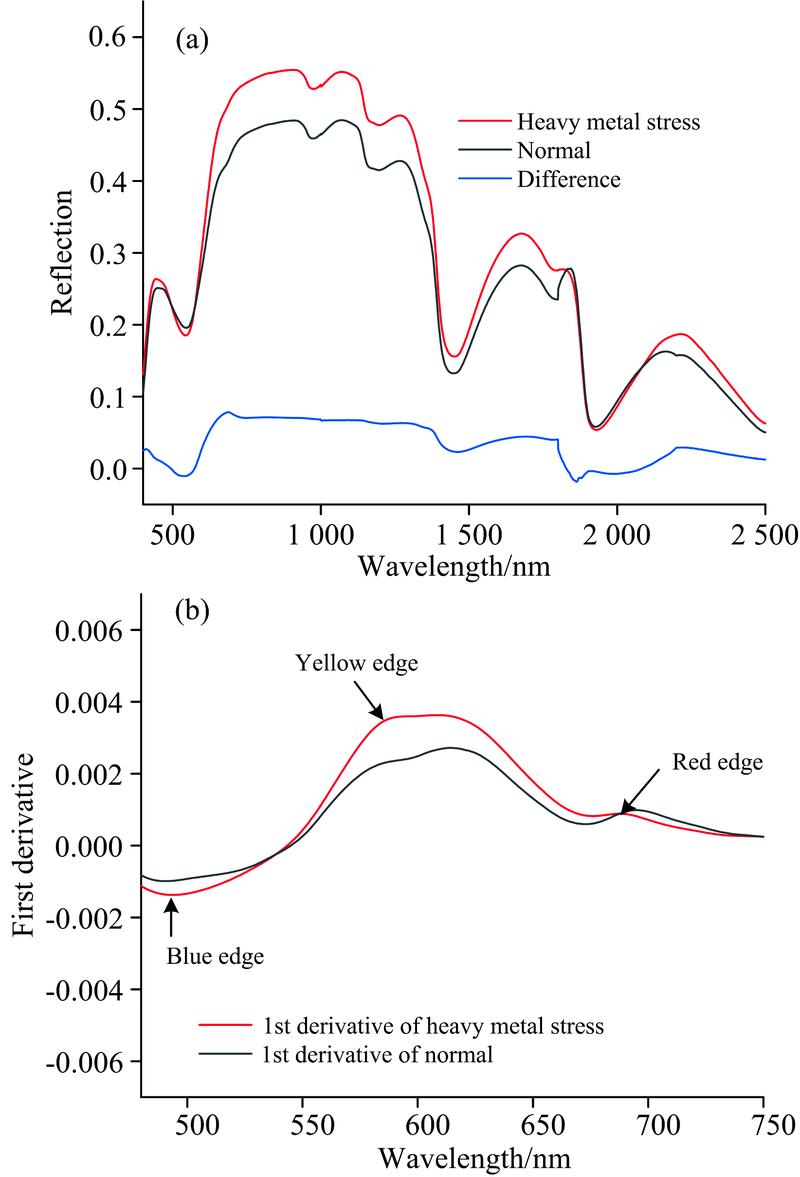
    Fig. 2. Reflectance spectra (a) and first derivative transformation (b) of leaves under heavy metal stress and normal leaves
    Pearson correlations of spectral data using four transformations
    Fig. 3. Pearson correlations of spectral data using four transformations
    Spatial distribution of three heavy metal elements
    Fig. 4. Spatial distribution of three heavy metal elements
    Accuracy verification of heavy metal content prediction model for Cd, As and Pb
    Fig. 5. Accuracy verification of heavy metal content prediction model for Cd, As and Pb
    含量/
    (mg·kg-1)
    背景值/
    (mg·kg-1)
    比值危害程度
    等级
    Cd0.1890.1191.5886
    As11.547.091.625
    Pb33.1724.61.354
    Cu29.7818.71.5923
    Zn5.24757.50.092
    Cr84.19329.82.831
    Table 1. Descriptive statistics of heavy metal content in soil
    叶片组蓝边
    位置/nm
    黄边
    位置/nm
    红边
    位置/nm
    红边
    斜率
    红边
    面积
    重金属胁迫4935806880.000 820.037
    正常4945796950.000 880.044
    Table 2. Parameter of blue edge, yellow edge and red edge
    变换形式元素特征波段及相关系数
    FD5509451 0801 7702 1202 270
    Cd-0.407**0.728**-0.359**0.354**-0.210*0.276*
    As-0.278*0.675**-0.398**0.342**-0.221*0.303**
    Pb-0.251*0.664**-0.420**0.330**-0.215*0.306**
    SD4309451 0001 0501 3751 630
    Cd0.342**-0.460**-0.351**-0.396**0.546**-0.253*
    As0.296*-0.434**-0.381**-0.364**0.514**-0.261*
    Pb0.294*-0.424**-0.399**-0.346**0.508**-0.259*
    RL7801 0901 3751 6401 8301 940
    Cd0.478**0.460**0.401**0.338**0.325**0.332**
    As0.424**0.414**0.355**0.291*0.278*0.261**
    Pb0.417**0.409**0.351**0.287*0.275*0.260**
    CR5607801 0901 3751 8302 180
    Cd-0.424**-0.485**-0.462**-0.414**-0.358**-0.356**
    As-0.339**-0.427**-0.413**-0.366**-0.309**-0.294*
    Pb-0.333**-0.419**-0.408**-0.361**-0.305**-0.290*
    Table 3. Correlation coefficients between the contents of three heavy metals and the characteristic absorption bands of four spectral transformation
    金属元素变化形式特征波段
    CdFD550945
    SD9451 0501 375
    RL7801 3751 640
    CR7801 3751 830
    AsFD945
    SD9451 0501 270
    RL7801 375
    CR7801 375
    PdFD945
    SD9451 0501 375
    RL7801 375
    CR7801 375
    Table 4. Characteristic band determined by stepwise regression
    植被
    指数
    计算公式相关系数
    CdAsPb
    NDVI705I1=(R750-R445)/(R750+R445)0.43**0.40**0.41**
    CRL2I2=(1/R510)-(1/R700)0.300.270.28
    SIPII3=(R800-R445)/(R800+R680)0.44**0.40**0.42**
    NDWII4=(R857-R1 241)/(R857+R1 241)-0.61**-0.58**-0.58**
    HMSVII5=(R1 375-R945)/(R1 375-R780)0.70**0.69**0.68**
    Table 5. Vegetation indexes and its correlation coefficients with the contents of three heavy metals
    元素拟合公式R2RMSE
    CdY=0.44X+0.1930.6310.220
    AsY=7.436lnX+13.1610.6331.394
    PbY=-15.359X+13.583X2+23.5410.6212.403
    Table 6. Spectral models of three heavy metals
    Hong-jun LIU, Teng NIU, Qiang YU, Kai SU, Lin-zhe YANG, Wei LIU, Hui-yuan WANG. Inversion and Estimation of Heavy Metal Element Content in Peach Forest Soil in Pinggu District of Beijing[J]. Spectroscopy and Spectral Analysis, 2022, 42(11): 3552
    Download Citation