• Acta Optica Sinica
  • Vol. 39, Issue 3, 0306001 (2019)
Xining Xu1、3 and Yongjun Chen2、*
Author Affiliations
  • 1 School of Mechanical, Electronic and Control Engineering, Beijing Jiaotong University, Beijing 100044, China
  • 2 School of Economics and Management Engineering, Beijing University of Civil Engineering and Architecture, Beijing 100044, China
  • 3 Key Laboratory of Vehicle Advanced Manufacturing, Measuring and Control Technology, Ministry of Education, Beijing Jiaotong University, Beijing 100044, China
  • show less
    DOI: 10.3788/AOS201939.0306001 Cite this Article Set citation alerts
    Xining Xu, Yongjun Chen. Curvature Sensing Measurement Based on Seven-Core Fiber and Few-Mode Fiber Splicing Structure[J]. Acta Optica Sinica, 2019, 39(3): 0306001 Copy Citation Text show less
    Structural diagram of curvature sensor
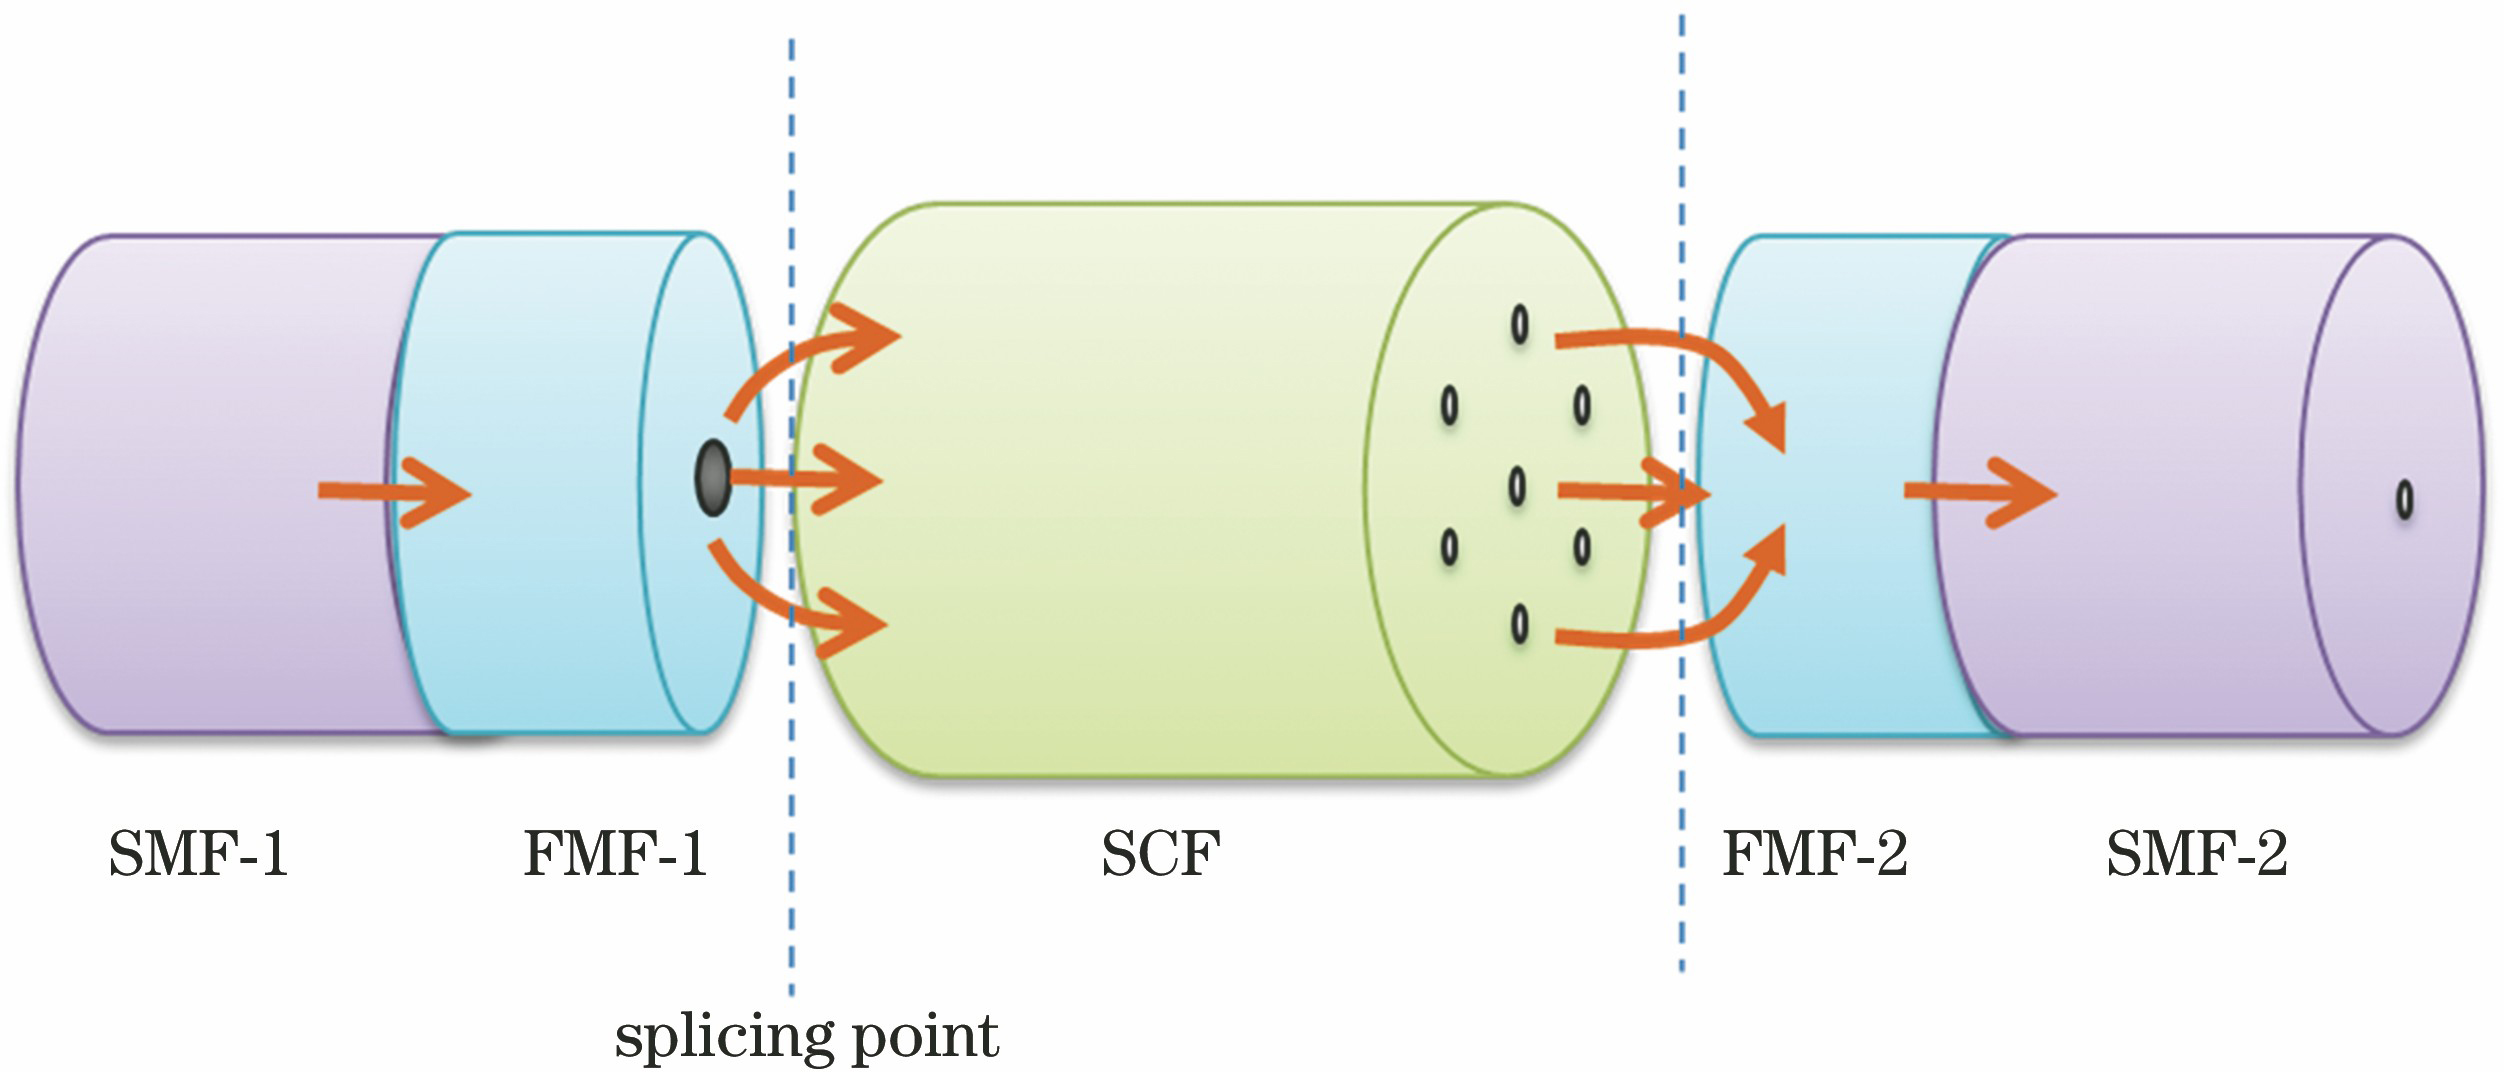
    Fig. 1. Structural diagram of curvature sensor
    Microscope images of cross section. (a) FMF; (b) SCF
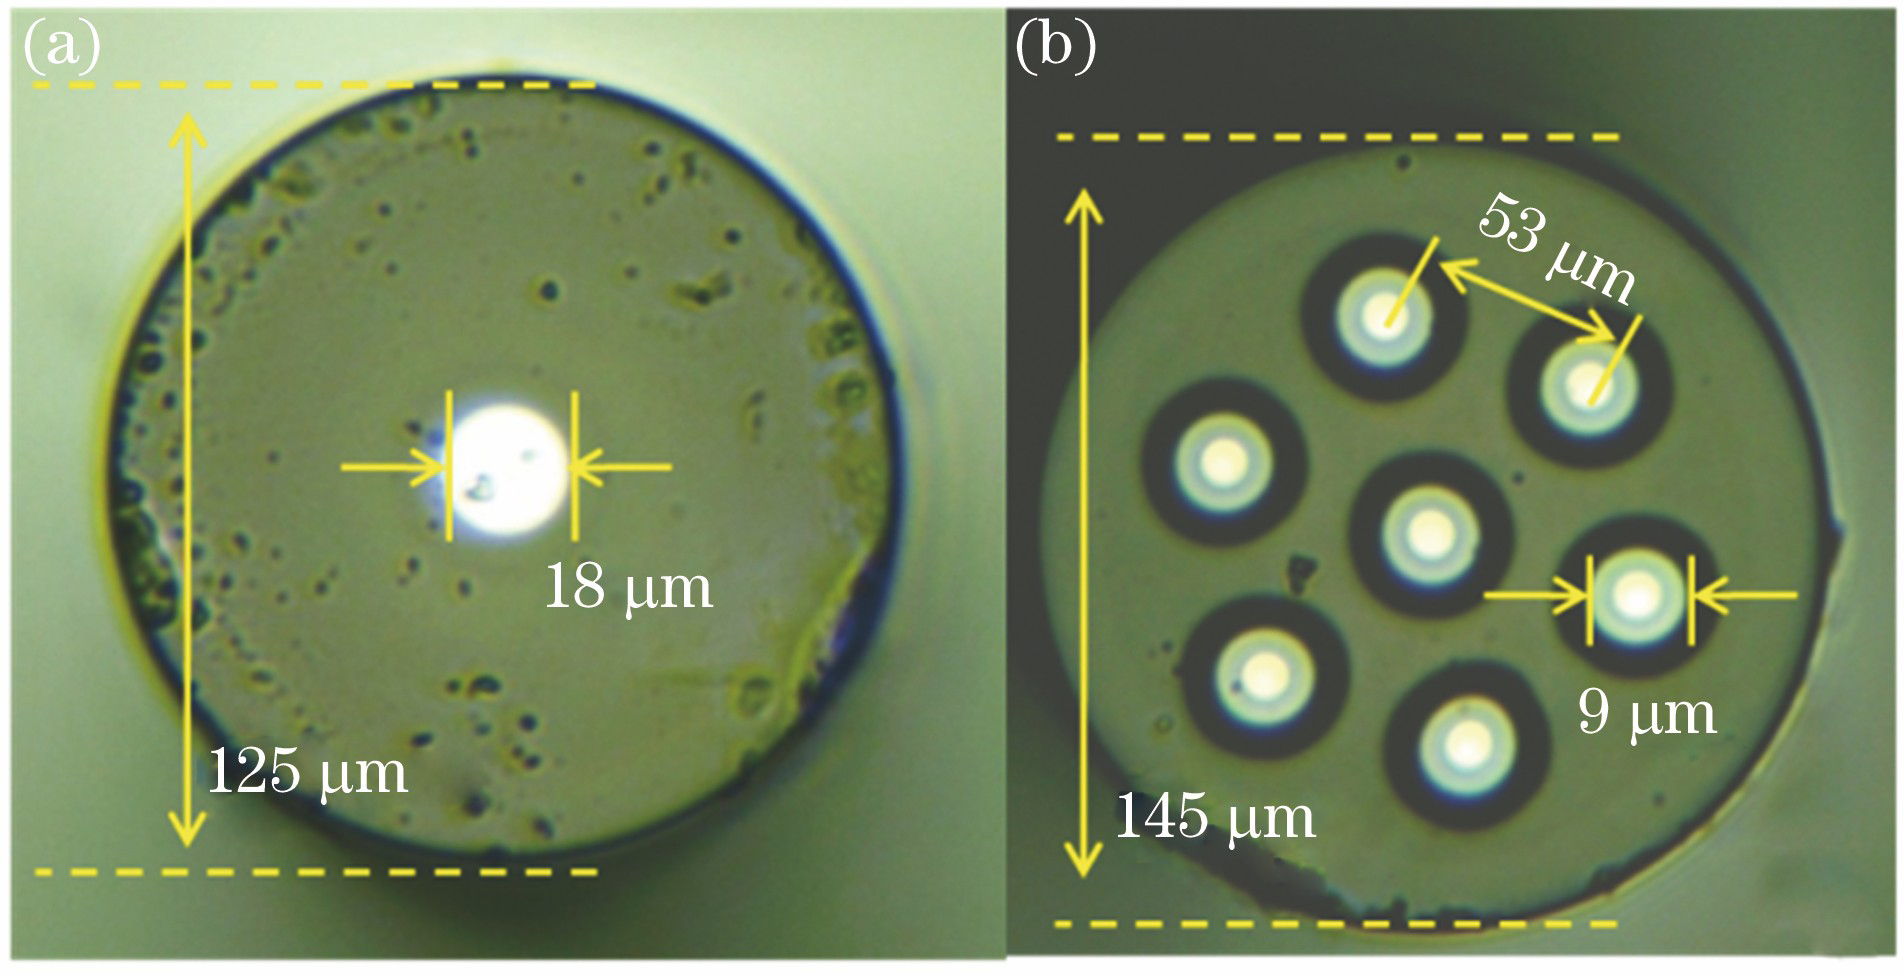
    Fig. 2. Microscope images of cross section. (a) FMF; (b) SCF
    Structural diagrams and microscope images of different sensing heads.(a) Straight type;(b) same direction mismatch type;(c) different direction mismatch type; (d) microscope image of straight type; (e) microscope image of mismatch type
    Fig. 3. Structural diagrams and microscope images of different sensing heads.(a) Straight type;(b) same direction mismatch type;(c) different direction mismatch type; (d) microscope image of straight type; (e) microscope image of mismatch type
    Test results of sensor A. (a) Optical spectrum; (b) frequency spectrum
    Fig. 4. Test results of sensor A. (a) Optical spectrum; (b) frequency spectrum
    Test results of sensor B. (a) Optical spectrum; (b) frequency spectrum
    Fig. 5. Test results of sensor B. (a) Optical spectrum; (b) frequency spectrum
    Test results of sensor C. (a) Optical spectrum; (b) frequency spectrum
    Fig. 6. Test results of sensor C. (a) Optical spectrum; (b) frequency spectrum
    Schematic of experimental setup
    Fig. 7. Schematic of experimental setup
    Experimental results of sensor A. (a) Spectrum versus curvature; (b) data fitting results
    Fig. 8. Experimental results of sensor A. (a) Spectrum versus curvature; (b) data fitting results
    Experimental results of sensor B. (a) Spectrum versus curvature; (b) data fitting results
    Fig. 9. Experimental results of sensor B. (a) Spectrum versus curvature; (b) data fitting results
    Experimental results of sensor C. (a) Spectrum versus curvature; (b) data fitting results
    Fig. 10. Experimental results of sensor C. (a) Spectrum versus curvature; (b) data fitting results
    SensortypeWavelength sensitivity /(nm·m-1)Intensity sensitivity /(dB·m-1)
    Sensor A6.338.57
    Sensor B30.8325.65
    Sensor C15.961.96
    Table 1. Sensing sensitivity comparison among different splicing methods
    StructureWavelength sensitivity /(nm·m-1)Intensity sensitivity /(dB·m-1)
    Mach-Zehnder interferometer based on PCF[13]3.046-
    Seven-core PCF[14]1.232-
    Polarization-maintaining PCF[15]93.950-
    PCF based on core-offset splicing and fiber taper[16]13.620-
    Proposed method30.83025.65
    Table 2. Sensor sensitivity comparison for different sensing structures
    Xining Xu, Yongjun Chen. Curvature Sensing Measurement Based on Seven-Core Fiber and Few-Mode Fiber Splicing Structure[J]. Acta Optica Sinica, 2019, 39(3): 0306001
    Download Citation