
Dewei Deng, Xianglu Zhao, Zhiye Huang, Junyu Wang, Shuhua Yang, Yong Zhang, Bin Chen. Laser Cleaning Process for Paint Removal and Its Effect on Surface Microstructures and Properties of KMN Steel[J]. Laser & Optoelectronics Progress, 2023, 60(1): 0114009
- Laser & Optoelectronics Progress
- Vol. 60, Issue 1, 0114009 (2023)
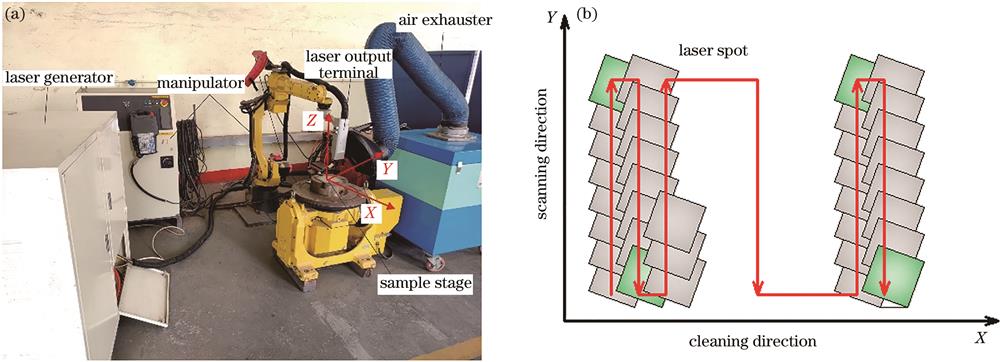
Fig. 1. Fiber laser cleaning system and scanning path of laser spot. (a) Laser cleaning system; (b) scanning path
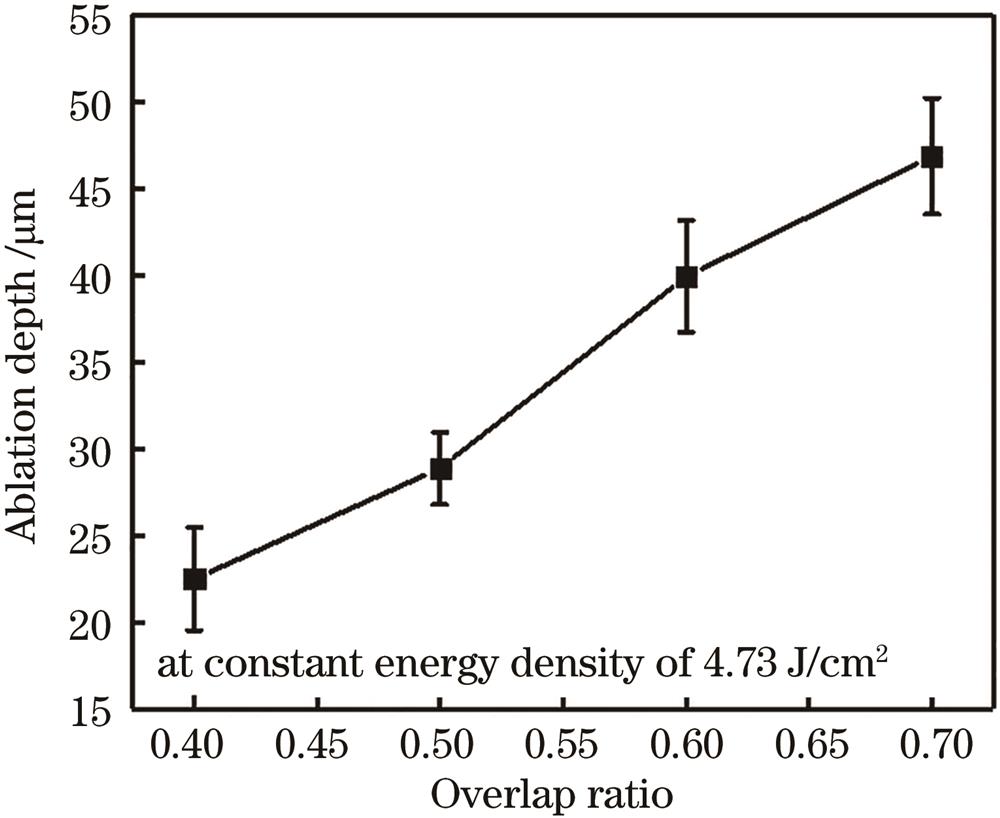
Fig. 2. Variation of ablation depth with overlap ratio at energy density of 4.73 J/cm2
Fig. 3. Surface morphology after single pass cleaning with different overlap ratios at energy density of 4.73 J/cm2. (a) Overlap ratio is 0.5; (b) overlap ratio is 0.6; (c) overlap ratio is 0.7; (d) overlap ratio is 0.8; (e) overlap ratio is 0.85; (f) overlap ratio is 0.895
Fig. 4. SEM images of sample surface after single pass cleaning at energy density of 4.73 J/cm2. (a) Overlap ratio is 0.7; (b) overlap ratio is 0.8
Fig. 5. Surface morphologies of substrates and samples after second pass cleaning at different parameters. (a) Surface morphology of substrate after grinding;(b) overlap ratio is 0.6 and energy density is 1.42 J/cm2; (c) overlap ratio is 0.6 and energy density is 1.89 J/cm2; (d) overlap ratio is 0.2 and energy density is 4.73 J/cm2; (e) overlap ratio is 0.3 and energy density is 4.73 J/cm2
Fig. 6. SEM image and EDS result of the sample after second pass cleaning at overlap ratio of 0.6 and energy density of 4.73 J/cm2. (a) SEM image; (b) EDS result
Fig. 7. Variation of roughness and roughness difference after second pass cleaning under different energy densities and overlap ratios. Variation of (a) roughness and (b) roughness difference with energy density at overlay ratio of 0.6; variation of (c) roughness and (d) roughness difference with overlap ratio at energy density of 4.73 J/cm2
Fig. 8. Cross-cut test results of the recoating paint after second pass cleaning at constant overlap ratio of 0.6 and different energy densities. (a) 1.89 J/cm2; (b) 2.84 J/cm2; (c) 3.31 J/cm2; (d) 3.78 J/cm2; (e) 4.25 J/cm2
Fig. 9. Cross-cut test results of the recoating paint after second pass cleaning at constant energy density of 4.73 J/cm2 and different overlap ratios. (a) Overlap ratio is 0.2; (b) overlap ratio is 0.3; (c) overlap ratio is 0.4; (d) overlap ratio is 0.5; (e) overlap ratio is 0.6
Fig. 10. Variation of surface hardness under different energy densities and overlap ratios after second pass cleaning. (a) Variation of surface hardness with energy density at constant overlap ratio of 0.6; (b) variation of surface hardness with overlap ratio at constant energy density of 4.73 J/cm2
Fig. 11. Metallographic structure of substrate surfaces after second pass cleaning at overlap ratio of 0.6 and different energy densities. (a) energy density of 1.89 J/cm2; (b) energy density of 2.84 J/cm2; (c) energy density of 3.78 J/cm2; (d) energy density of 4.73 J/cm2
Fig. 12. Variation of surface grain size under different energy densities and overlap ratios after second pass cleaning. (a) Variation of grain size with energy density at constant overlap ratio of 0.6; (b) variation of grain size with overlap ratio at constant energy density of 4.73 J/cm2
Fig. 13. Indentation shape of the substrate at different stress states and corresponding schematic diagrams. (a) Stress-free state in the internal substrate; (b) compressive stress state on the grinding surface; (c) tensile stress state on the laser-cleaned surface
|
Table 1. Device parameter information
|
Table 2. Element composition of KMN steel
|
Table 3. Elemental composition of epoxy silicone paint
|
Table 4. Surface residue EDS results

Set citation alerts for the article
Please enter your email address
© Copyright 2018-2021 | Chinese Laser Press. All Rights Reserved 沪ICP备15018463号-20