• Spectroscopy and Spectral Analysis
  • Vol. 42, Issue 6, 1855 (2022)
Gan-lin WANG*, Qian LIU1;, Ding-ming LI1;, Su-liang YANG1; *;, and Guo-xin TIAN1; 2; *;
Author Affiliations
  • 1. Department of Radiochemistry, China Institute of Atomic Energy, Beijing 102413, China
  • show less
    DOI: 10.3964/j.issn.1000-0593(2022)06-1855-07 Cite this Article
    Gan-lin WANG, Qian LIU, Ding-ming LI, Su-liang YANG, Guo-xin TIAN. Quantitative Analysis of NO3-, SO42-, ClO4- With Water as Internal Standard by Raman Spectroscopy[J]. Spectroscopy and Spectral Analysis, 2022, 42(6): 1855 Copy Citation Text show less
    Raman spectra of NaNO3 (a, b), Na2SO4 (c, d), NaClO4 (e, f) solutions with different
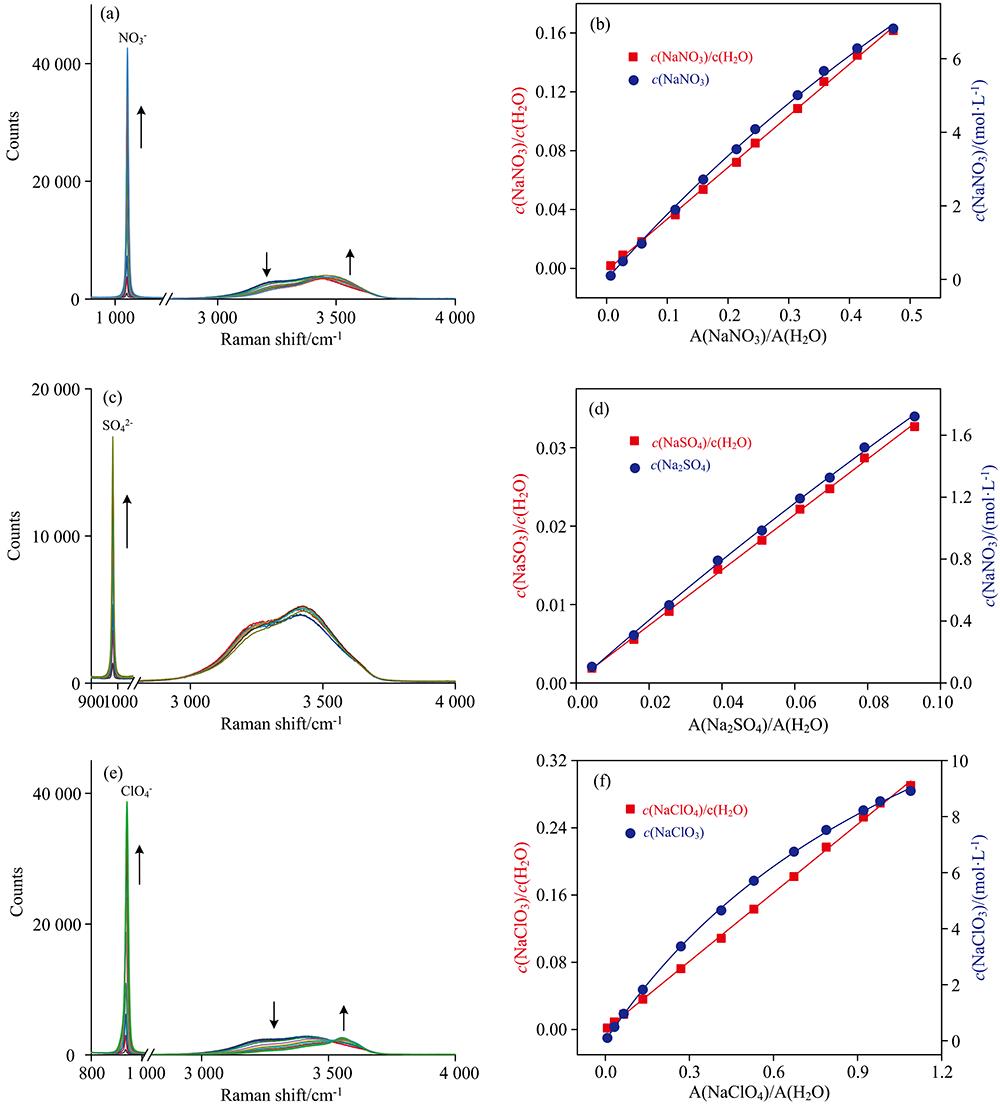
    Fig. 1. Raman spectra of NaNO3 (a, b), Na2SO4 (c, d), NaClO4 (e, f) solutions with different
    AB工作曲线R2
    NaNO318.80.6c=18.8RS/(1+0.6RS)0.999 1
    Na2SO420.21.0c=20.2RS/(1+1.0RS)0.998 8
    NaClO415.00.7c=15.0RS/(1+0.7RS)0.999 8
    Table 1. Working curves curve of NaNO3, Na2SO4, NaClO4
    cNaClO4
    /(mol·L-1)
    cNaNO3/(mol·L-1)
    1.63.04.25.36.3
    (4)(8)(4)(8)(4)(8)(4)(8)(4)(8)
    0.171.40.52.61.82.71.93.12.31.91.1
    0.357.15.18.16.26.54.65.03.22.91.3
    0.529.86.67.84.76.73.84.31.73.81.4
    0.708.24.26.22.45.01.53.2-0.25.72.5
    Table 2. Deviation of NaNO3 analysis results under different concentrations of NaClO4
    cNaNO3
    /(mol·L-1)
    cNaClO4/(mol·L-1)
    0.170.350.520.70
    (4)(8)(4)(8)(4)(8)(4)(8)
    1.63.0-1.83.7-1.43.4-1.63.7-1.4
    3.07.7-1.89.7-0.68.5-1.58.4-1.8
    4.231.314.327.210.419.23.619.94.0
    5.341.717.436.413.423.63.027.25.7
    Table 3. Deviation of NaClO4 analysis results under different concentrations of NaNO3
    cNaClO4
    /(mol·L-1)
    cNa2SO4/(mol·L-1)
    0.40.71.01.31.5
    (4)(8)(4)(8)(4)(8)(4)(8)(4)(8)
    0.20-2.2-3.2-0.6-1.5-2.4-3.3-2.2-3.1-3.8-4.1
    0.39-0.9-2.8-3.2-5.0-2.6-4.4-1.9-3.74.72.9
    0.58-3.6-6.3-2.7-5.4-0.8-3.6-0.2-2.9-2.8-5.4
    0.76-4.2-7.7-3.1-6.6-2.4-6.0-1.9-5.5-1.4-4.9
    Table 4. Deviation of Na2SO4 analysis results under different concentrations of NaClO4
    cNa2SO4
    /(mol·L-1)
    cNaClO4/(mol·L-1)
    0.200.390.580.76
    (4)(8)(4)(8)(4)(8)(4)(8)
    0.4-4.2-6.10.4-1.6-2.1-4.0-0.4-2.2
    0.7-0.8-4.2-1.2-4.4-1.2-4.40.4-2.9
    1.0-1.9-6.40.5-4.10.3-3.91.0-3.6
    1.3-2.3-8.00.1-5.80.7-5.31.6-4.4
    1.5-2.3-9.0-6.2-13.2-0.7-7.51.9-5.3
    Table 5. Deviation of NaClO4 analysis results under different concentrations of Na2SO4
    cNaNO3
    /(mol·L-1)
    cNa2SO4/(mol·L-1)
    0.40.71.01.31.6
    (4)(8)(4)(8)(4)(8)(4)(8)(4)(8)
    0.20-1.8-2.4-1.7-2.2-0.9-1.5-0.7-1.4-4.0-4.6
    0.490.2-1.21.3-2.7-0.1-1.5-1.5-2.9-1.8-3.2
    0.78-2.7-4.94.41.9-1.8-4.1-2.2-4.5-0.7-3.0
    1.03-4.1-6.8-1.9-4.80.1-2.90.2-2.9-1.6-4.6
    Table 6. Deviation of Na2SO4 analysis results under different concentrations of NaNO3
    cNa2SO4
    /(mol·L-1)
    cNaClO4/(mol·L-1)
    0.200.490.781.03
    (4)(8)(4)(8)(4)(8)(4)(8)
    0.419.517.114.011.63.01.14.72.7
    0.720.316.29.35.77.03.43.90.5
    1.025.719.713.48.12.2-2.27.72.6
    1.339.330.717.910.96.30.311.04.3
    1.644.433.920.811.911.03.212.13.9
    Table 7. Deviation of NaNO3 analysis results under different concentrations of Na2SO4
    Gan-lin WANG, Qian LIU, Ding-ming LI, Su-liang YANG, Guo-xin TIAN. Quantitative Analysis of NO3-, SO42-, ClO4- With Water as Internal Standard by Raman Spectroscopy[J]. Spectroscopy and Spectral Analysis, 2022, 42(6): 1855
    Download Citation