
Chaoliang Chen, Weisong Shi, Zhiyuan Qiu, Victor X. D. Yang, Wanrong Gao. B-scan-sectioned dynamic micro-optical coherence tomography for bulk-motion suppression[J]. Chinese Optics Letters, 2022, 20(2): 021102
- Chinese Optics Letters
- Vol. 20, Issue 2, 021102 (2022)
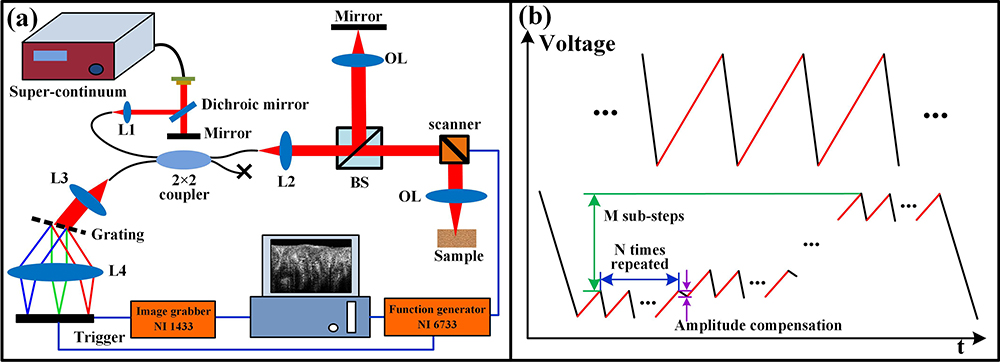
Fig. 1. (a) Illustration for the BD-MOCT system; L1–L4, achromatic lens; BS, beam splitter; OL, objective lens. (b) The illustration for the two scanning protocols. The top and the bottom panels are, respectively, the conventional raster scanning protocol and the B-scan-sectioned scanning protocol. The data acquisition occurs in forward scanning (red paths), and the duty cycle is 77%. In the B-scan-sectioned scanning protocol, each full B-scan is divided into M sub-B-scans, and each sub-B-scan is repeated N times.
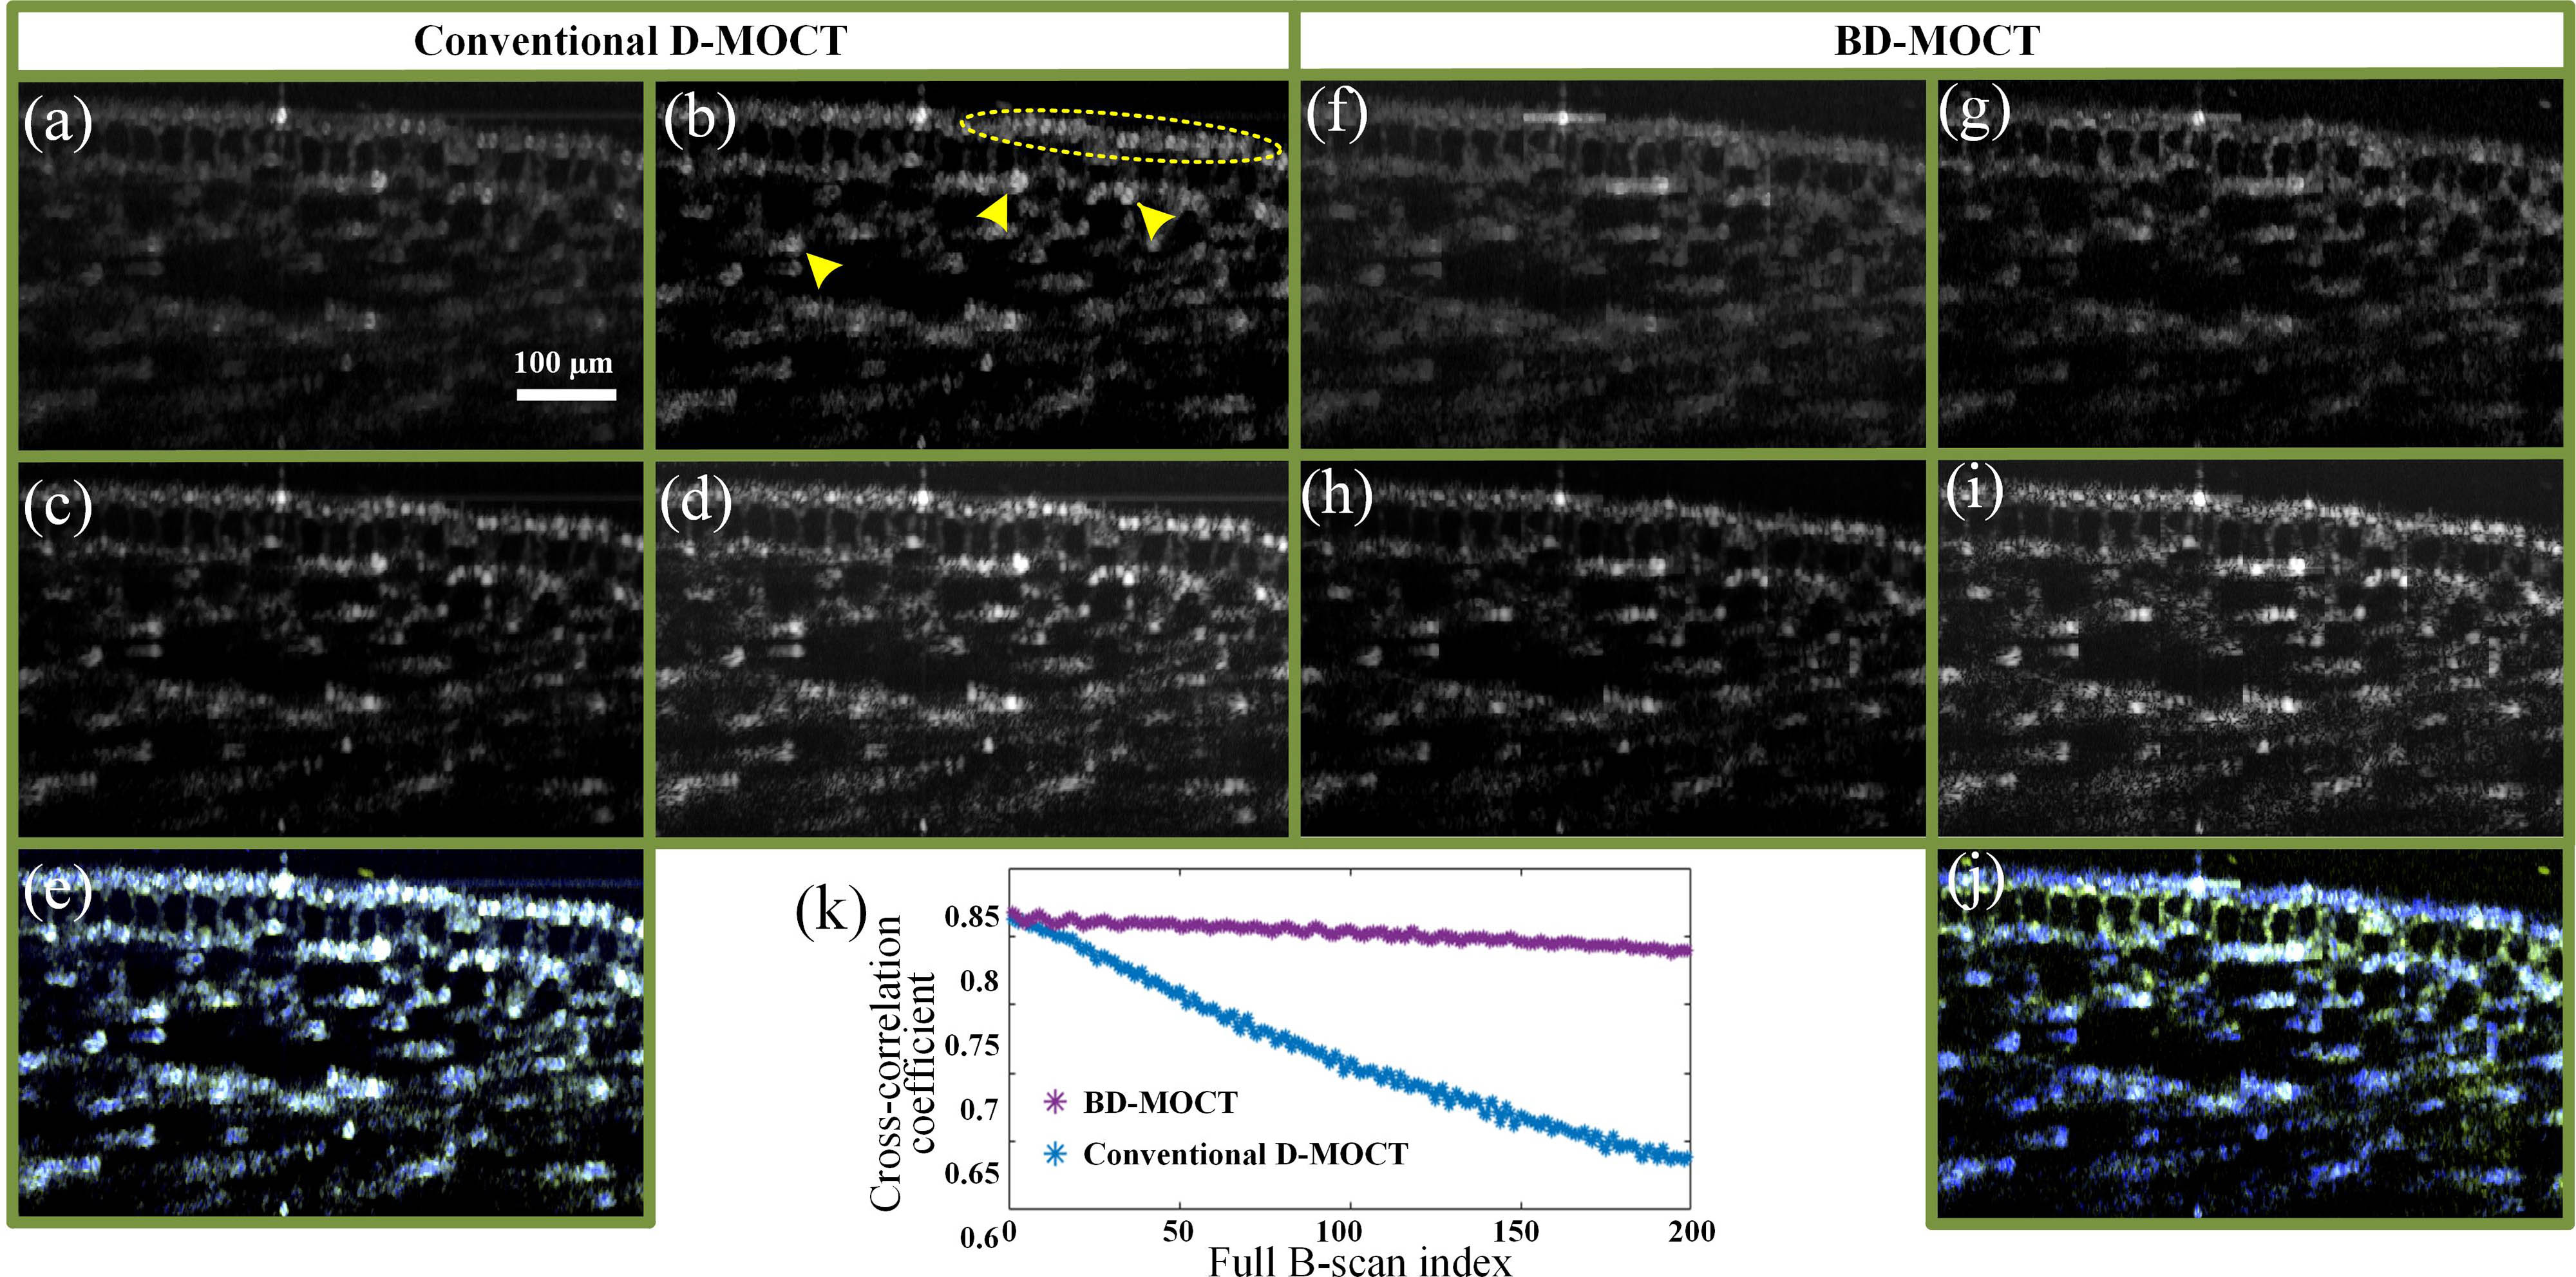
Fig. 2. Images of onion core tissue. (a)–(c) The red-, green-, and blue-channel images of the onion core tissue obtained by conventional D-MOCT. (d) The averaged structural image of the 200 B-scans. (e) The merged dynamic contrast image. (f)–(h) The red-, green-, and blue-channel images of the onion core tissue obtained by BD-MOCT. (i) The averaged structural image of the 200 B-scans. (j) The merged dynamic contrast image. (k) The cross-correlation coefficients between the first B-scan and the following 199 B-scans of the two methods. Blue-channel image: 0–Fs/200; green-channel image: Fs/200–Fs/40; red-channel image: Fs/40–Fs/2. (a)–(j) share the same scale bar.
Fig. 3. Images of a zebrafish’s intestines. (a)–(c) The red-, green-, and blue-channel images of a zebrafish’s intestines obtained by conventional D-MOCT. (d) The averaged structural image of the 200 B-scans. (e) The merged dynamic contrast image. (f)–(h) The red-, green-, and blue-channel images of a zebrafish’s intestines obtained by BD-MOCT. (i) The averaged structural image of the 200 B-scans. (j) The merged dynamic contrast image. Blue-channel image: 0–Fs/200; green-channel image: Fs/200–Fs/40; red-channel image: Fs/40–Fs/2. (a)–(j) share the same scale bar.
Fig. 4. (a) Image of the extra bandwidth (13.5–104.5 Hz) achieved by BD-MOCT over the conventional D-MOCT. (b) Cross-correlation coefficients between the first B-scan and the following 199 B-scans of the two methods.

Set citation alerts for the article
Please enter your email address
© Copyright 2018-2021 | Chinese Laser Press. All Rights Reserved 沪ICP备15018463号-20