
Chaoliang Chen, Weisong Shi, Zhiyuan Qiu, Victor X. D. Yang, Wanrong Gao. B-scan-sectioned dynamic micro-optical coherence tomography for bulk-motion suppression[J]. Chinese Optics Letters, 2022, 20(2): 021102
- Chinese Optics Letters
- Vol. 20, Issue 2, 021102 (2022)
Abstract
1. Introduction
Dynamic optical coherence tomography (D-OCT)[
Micro-optical coherence tomography (MOCT) proposed by Liu et al.[
Similar to the moving scatterers, bulk motions can also modulate the backscattered intensities, resulting in degradation on the image quality of the dynamic contrast images. The influence of bulk motions on D-MOCT imaging is inevitable and severe due to the following: (1) data acquisition time is relatively long for D-MOCT, because hundreds of B-scans from each position need to be acquired; (2) the spatial resolution of the D-MOCT system is at the micron level, so even slight bulk shifts could effectively blur the obtained images, such as tissue elasticity and environmental vibrations (especially from the systems on mobile carts in clinics). Furthermore, it is also challenging to precisely compensate bulk motions with image registration algorithms because sub-pixel location shifts occur.
Sign up for Chinese Optics Letters TOC. Get the latest issue of Chinese Optics Letters delivered right to you!Sign up now
In this Letter, we present a B-scan-sectioned D-MOCT (BD-MOCT) for achieving high-quality dynamic contrast images. In the proposed technique, a B-scan-sectioned scanning protocol was performed, where each full B-scan was evenly divided into several sections (termed sub-B-scans), and each sub-B-scan was repeated hundreds of times before the sample beam moved to the next sub-B-scan. After all sub-B-scans were completely acquired, we stitched all of the sub-B-scans into the same number of full B-scans for the following data process. In this way, the time interval between two consecutive stitched B-scans could be reduced multiple times compared to the conventional raster scanning protocol, achieving bulk-motion suppression and image quality improvement. Meanwhile, the total data acquisition time stayed almost the same.
2. Methods
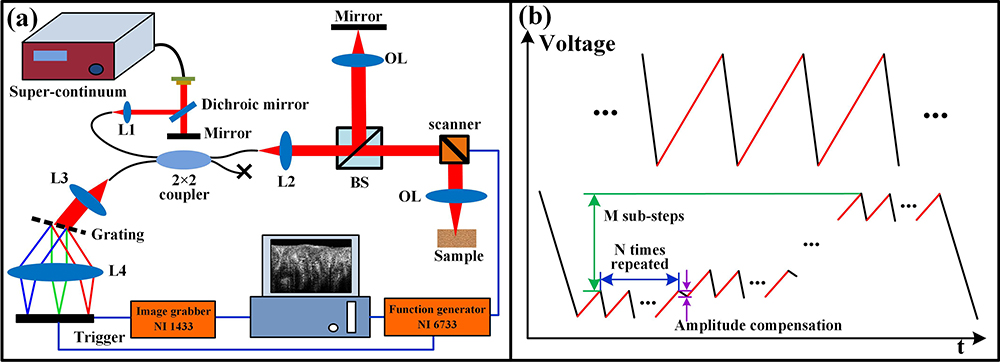
Figure 1(a) illustrates the system structure we used in this study. The optical beam with a spectral bandwidth of 400–2300 nm from a super-continuum light source (SC400-2, Fianuim, UK) hits a dichroic mirror (DMLP1000T, Thorlabs, US), and the spectrum below 1 µm is reflected and coupled by L1 with a focal length of 10 mm into one arm of a fiber coupler (split ratio: 90:10). Ten percent of the optical power is collimated by L2 (focal length: 19 mm) and then goes into a Michelson interferometer, where the beam is split into reference and sample beams by a 50:50 beam splitter cube. Two objective lenses () focus the two beams on a mirror and the sample, respectively, and the achieved lateral resolution is . In the sample arm, the beam is reflected by a galvo-mirror (Thorlabs, US) for transverse scanning. The reflected light from the two arms interferes at the cube splitter and goes back to the fiber coupler. A home-built spectrometer (spectral range: 725–1000 nm) is used for fringe detection, which achieves an axial resolution of with an approximated refractive index of 1.4 for the tissue sample. The camera (EM4, e2v, UK) has 4096 pixels and runs at 37 kHz. The grating (1002-1, Wasatch, US) has a resolution of 1200 lines/mm. In the sample arm, the optical power on the sample is , and the achieved sensitivity is , measured by inserting an optical neutral-density filter with in the sample arm.
![]()
Figure 1.(a) Illustration for the BD-MOCT system; L1–L4, achromatic lens; BS, beam splitter; OL, objective lens. (b) The illustration for the two scanning protocols. The top and the bottom panels are, respectively, the conventional raster scanning protocol and the B-scan-sectioned scanning protocol. The data acquisition occurs in forward scanning (red paths), and the duty cycle is 77%. In the B-scan-sectioned scanning protocol, each full B-scan is divided into M sub-B-scans, and each sub-B-scan is repeated N times.
Figure 1(b) shows the B-scan-sectioned scanning protocol used in BD-MOCT. Each full B-scan is divided into M sub-B-scans, and each sub-B-scan is repeated N times before the sample beam moves to the next sub-B-scan. After all sub-B-scans are completely acquired, we stitch all of the sub-B-scans into the same number of full B-scans. Compared to conventional raster scanning, the time interval between the consecutive stitched B-scans can be reduced about M times. Consequently, the bulk motions can be effectively suppressed to improve the quality of dynamic contrast images. In this study, each full B-scan was uniformly divided into sub-B-scans, and each sub-B-scan was repeated times for dynamic information extraction. To achieve a perfect mosaic of multiple sub-B-scan images, the galvo-driving voltages of the two adjacent sub-B-scans were slightly overlapped, and four extra A-scans on each side of each sub-B-scan were acquired for compensating the blurred parts caused by the inertia of the galvo-mirror. Therefore, the raw A-scan number of each full B-scan was 1088, and the A-scan number for the stitched B-scan was 1024. The conventional scanning protocol with the A-scan number of 1024 was also performed on the same tissue sample, and the obtained images were compared for demonstrating the performance of the proposed technique. The duty cycle of the sawtooth wave (galvo-driving signal) for both scanning protocols was 77%, and the resultant time intervals between two conventional B-scans and two stitched B-scans were and , respectively. The corresponding sampling frequencies (Fs) for recording the dynamic signals were about 38 Hz and 286 Hz in the two scanning protocols. The data acquisition time for each dataset was . The BD-MOCT system was located on a non-floated optical table to mimic clinical environmental applications.
To improve the precision of image stitching, we performed a calibration step to find the optimized compensation amplitude value [marked in Fig. 1(b)] between two adjacent sub-B-scans. Similar to our previous work[
3. Results
We first demonstrated the performance of BD-MOCT on onion core tissue imaging. The cells of onion tissue are big, and less scattering occurs inside of the cells due to the vacuoles. In this way, most scattered photons are from the cell walls, which make it easier to see the influence of bulk motions on the dynamic signal extraction procedure from the obtained dynamic contrast images. A small piece of tissue was extracted from the onion core and immediately immersed in a drop of saline on a glass slide for scanning. The obtained images are shown in Fig. 2. In comparing Figs. 2(a)–2(c) and Figs. 2(f)–2(h), we can see that the red- and blue-channel images between the two methods are very close; but for the green-channel image in Fig. 2(b), the cell walls (especially the regions marked by the dashed yellow ellipse and yellow arrows) are much more blurred and brighter compared to Fig. 2(g). In comparison of the merged color images in Figs. 2(e) and 2(j), it can be seen that Fig. 2(j) has a more detailed colorful contrast for the dynamic signals, while almost all the structures are in white in Fig. 2(e) (even for the surface of the tissue). We also calculated the cross-correlation coefficients between the first B-scan and the following 199 B-scans for a quantitative comparison, and the plots are shown in Fig. 2(k). It is seen that the correlation degree of BD-MOCT reduced much more gently than that of the conventional D-MOCT, demonstrating that bulk motions were suppressed well by the B-scan-sectioned scanning protocol.
![]()
Figure 2.Images of onion core tissue. (a)–(c) The red-, green-, and blue-channel images of the onion core tissue obtained by conventional D-MOCT. (d) The averaged structural image of the 200 B-scans. (e) The merged dynamic contrast image. (f)–(h) The red-, green-, and blue-channel images of the onion core tissue obtained by BD-MOCT. (i) The averaged structural image of the 200 B-scans. (j) The merged dynamic contrast image. (k) The cross-correlation coefficients between the first B-scan and the following 199 B-scans of the two methods. Blue-channel image: 0–Fs/200; green-channel image: Fs/200–Fs/40; red-channel image: Fs/40–Fs/2. (a)–(j) share the same scale bar.
An ex vivo experiment was further performed for testing the performance of BD-MOCT. In this experiment, we scanned a zebrafish’s intestines with two scanning protocols and calculated both dynamic contrast images for comparison. The intestines were immediately immersed in cell culture medium after extraction for scanning. This study was approved by the Animal Research Ethics Committee at the university. The obtained results are shown in Fig. 3. In comparison of the three channel images of the two methods, we can see that Figs. 3(a) and 3(c) are very close to Figs. 3(f) and 3(h), respectively, which agrees well with the onion’s results. However, the green-channel images [Figs. 3(b) and 3(g)] are apparently different, where Fig. 3(g) has richer dynamic information. The averaged structural images of Figs. 3(d) and 3(i) are also similar to each other. Comparing Figs. 3(e) and 3(j), we could see that Fig. 3(e) is globally redder, indicating that more dynamic signals were detected in the high-frequency band. Because the two images are from the same location of tissue sample, we believe the extra detected dynamic information in Fig. 3(e) was from bulk motions. From the two magnified local areas of Region I and Region II, we can see that some locations in Fig. 3(e) (such as those marked by yellow arrows) are blurred, and less sub-cellular information is achieved compared to Fig. 3(j). The results demonstrate that the proposed technique could effectively suppress the bulk motions and improve the quality of dynamic contrast images. Furthermore, we also calculated the SNR of the three channel images with the two local regions marked by the green and red rectangles in Fig. 3(d) for quantitative comparisons; the SNRs of Figs. 3(a)–3(c) are 31.9, 28.2, and 31.4 dB, respectively, while those of Figs. 3(f)–3(h) are 33.1, 27.4, and 30.2 dB, respectively. It could be seen that the B-scan-sectioned scanning protocol barely affected the image quality of each channel. The SNR was calculated by
![]()
Figure 3.Images of a zebrafish’s intestines. (a)–(c) The red-, green-, and blue-channel images of a zebrafish’s intestines obtained by conventional D-MOCT. (d) The averaged structural image of the 200 B-scans. (e) The merged dynamic contrast image. (f)–(h) The red-, green-, and blue-channel images of a zebrafish’s intestines obtained by BD-MOCT. (i) The averaged structural image of the 200 B-scans. (j) The merged dynamic contrast image. Blue-channel image: 0–Fs/200; green-channel image: Fs/200–Fs/40; red-channel image: Fs/40–Fs/2. (a)–(j) share the same scale bar.
Since the BD-MOCT technique reduced the time interval between the consecutive stitched B-scans, the sampling frequency for recording the dynamic signals was improved, achieving a wider power spectrum for constructing D-MOCT images. We calculated the extra bandwidth signals (13.5–104.5 Hz) achieved by BD-MOCT over the conventional D-MOCT, and the result is shown in Fig. 4(a). Furthermore, the correlation coefficients between the first B-scan and the following 199 B-scans were also calculated for a quantitative comparison, as shown in Fig. 4(b). It is seen that the correlation degree of BD-MOCT drops much more slowly than that of conventional D-MOCT, which also agrees with the onion tissue’s results. Because both moving scatterers and bulk motions could cause correlation degree loss, and the two datasets are from the same location of the tissue sample, we believe that the extra loss of blue plot compared to purple plot is caused by bulk motions, which demonstrates the performance of BD-MOCT.
![]()
Figure 4.(a) Image of the extra bandwidth (13.5–104.5 Hz) achieved by BD-MOCT over the conventional D-MOCT. (b) Cross-correlation coefficients between the first B-scan and the following 199 B-scans of the two methods.
4. Discussion and Conclusion
The D-MOCT technique achieves sub-cellular dynamic contrast by recording and analyzing the power spectrum of the backscattered signals (in time direction) at each spatial location. Because cell size is tiny and hundreds of B-scans need to be acquired for power spectrum calculation, bulk motions may severely degrade the quality of the obtained dynamic contrast images. An obvious way to suppress the bulk motions is to improve the A-scan rate[
In this work, we empirically scanned each location 200 times for sub-cellular dynamic information extraction based on Leung’s[
We divided each full B-scan into eight sub-B-scans to suppress bulk motions in this work, and, theoretically, this number could be higher to further reduce the time interval between them. However, the scanning efficiency (effective A-scans/total A-scans) drops as the sub-B-scan number increases, because eight extra A-scans were acquired for compensating the blurred regions caused by inertia of the galvo-mirror. The investigation on optimizing this time interval might be helpful for the ultrahigh-speed OCT systems, such as the 600 kHz D-MOCT system[
Since D-MOCT is very sensitive to bulk motions because of high spatial resolutions, the proposed technique could effectively suppress the relatively weak bulk motions caused by tissue elasticity or environmental vibrations. For the strong bulk motions such as those that occurred during in vivo scanning, a few improvements on our current system might be needed, such as hardware speed and hand-held probe.
In summary, we present a BD-MOCT for achieving high-quality sub-cellular dynamic contrast images, where each full B-scan is divided into multiple sub-B-scans, and hundreds of repeated scans are performed before the sample beam moves to the next sub-B-scan. In this way, the time interval between the consecutive B-scans could be reduced multiple times to effectively suppress bulk motions. The clinical OCT systems are commonly placed on mobile carts (instead of floated optical tables); the environmental vibrations are inevitable and may severely degrade the quality of dynamic contrast images. The proposed technique may provide a way to overcome this kind of issue in clinical applications.
References
[1] C. Apelian, F. Harms, O. Thouvenin, A. C. Boccara. Dynamic full field optical coherence tomography: subcellular metabolic contrast revealed in tissues by interferometric signals temporal analysis. Biomed. Opt. Express, 7, 1511(2016).
[2] J. Scholler, O. Thouvenin, K. Grieve, K. Groux, C. Boccara, V. Mazlin, M. Fink, J.-A. Sahel, P. Xiao. Probing dynamic processes in the eye at multiple spatial and temporal scales with multimodal full field OCT. Biomed. Opt. Express, 10, 731(2019).
[3] J. Scholler, K. Groux, O. Goureau, J. A. Sahel, M. Fink, S. Reichman, C. Boccara, K. Grieve. Dynamic full-field optical coherence tomography: 3D live-imaging of retinal organoids. Light Sci. Appl., 9, 140(2020).
[4] I. A. El-Sadek, A. Miyazawa, L. T. Shen, S. Makita, S. Fukuda, T. Yamashita, Y. Oka, P. Mukherjee, S. Matsusaka, T. Oshika, H. Kano, Y. Yasuno. Optical coherence tomography-based tissue dynamics imaging for longitudinal and drug response evaluation of tumor spheroids. Biomed. Opt. Express, 11, 6231(2020).
[5] L. Liu, J. A. Gardecki, S. K. Nadkarni, J. D. Toussaint, Y. Yagi, B. E. Bouma, G. J. Tearney. Imaging the subcellular structure of human coronary atherosclerosis using micro-optical coherence tomography. Nat. Med., 17, 1010(2011).
[6] H. M. Leung, M. L. Wang, H. Osman, E. Abouei, C. MacAulay, M. Follen, J. A. Gardecki, G. J. Tearney. Imaging intracellular motion with dynamic micro-optical coherence tomography. Biomed. Opt. Express, 11, 2768(2020).
[7] M. Münter, M. vom Endt, M. Pieper, M. Casper, M. Ahrens, T. Kohlfaerber, R. Rahmanzadeh, P. König, G. Hüttmann, H. Schulz-Hildebrandt. Dynamic contrast in scanning microscopic OCT. Opt. Lett., 45, 4766(2020).
[8] C. Chen, W. Shi, R. Reyes, V. X. D. Yang. Buffer-averaging super-continuum source based spectral domain optical coherence tomography for high speed imaging. Biomed. Opt. Express, 9, 6529(2018).
[9] M. Münter, M. Pieper, T. Kohlfaerber, E. Bodenstorfer, M. Ahrens, C. Winter, R. Huber, P. König, G. Hüttmann, H. Schulz-Hildebrandt. Microscopic optical coherence tomography (mOCT) at 600 kHz for 4D volumetric imaging and dynamic contrast. Biomed. Opt. Express, 12, 6024(2021).

Set citation alerts for the article
Please enter your email address
© Copyright 2018-2021 | Chinese Laser Press. All Rights Reserved 沪ICP备15018463号-20